

Cyclical Path
June 11, 2018, 8:10 AM
Indicators
3 Comments
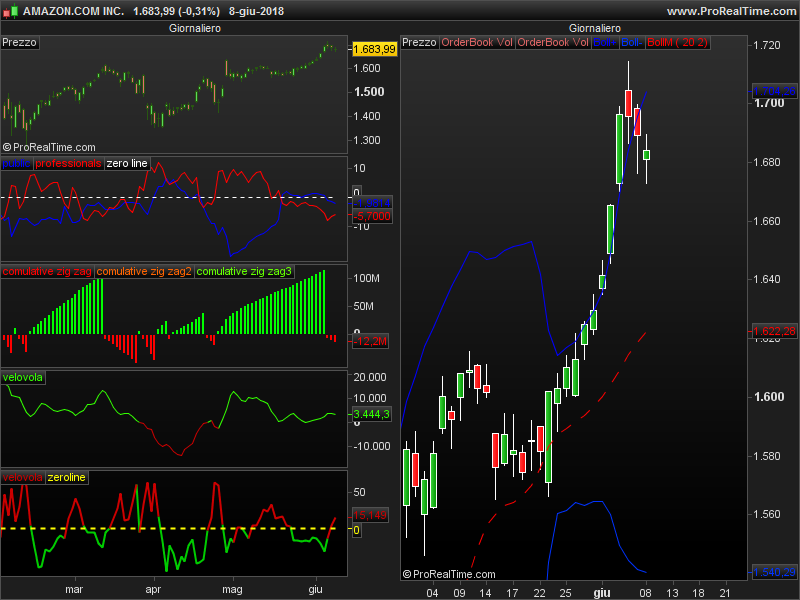
This is a simple indicator, similar to a MACD, which makes the difference between a slow and a faster period of 2 linear regression curves.
- buy when the oscillator cross under the zeroline and sell and it crosses over the zeroline
// pista ciclica
// buy crossunder zeroline and sell crossover zeroline
// by carlini mauro
//
lenta = linearregression[14](close)
veloce = linearregression[2](close)
pista = lenta-veloce
if pista < 0 then
 color=-1
else
 if pista > 0 then
  color=1
 endif
endif
RETURN pista COLOURED by color STYLE (line)as "velovola" , 0 as "zeroline"
Download
Filename:
pista-ciclica.itf
Downloads:
193
Average
This author is like an anonymous function, present but not directly identifiable. More details on this code architect as soon as they exit 'incognito' mode.
Author’s Profile
Loading...