

Cybernetic Oscillator
The Cybernetic Oscillator is a zero-centered, energy-normalized momentum oscillator inspired by John Ehlers’ digital signal processing work. It combines a high-pass filter to remove drift, a 2nd-order Super Smoother to reduce noise, and RMS normalization so the amplitude remains comparable across markets and timeframes. The result is a responsive, clean oscillator that highlights direction changes and strength without being dominated by raw volatility.
Key Features at a Glance
- Band-pass behavior: High-pass → Super Smoother low-pass chain isolates tradable swings.
- RMS normalization: Divides by rolling RMS of the filtered signal to stabilize amplitude.
- Zero-centered: Clear polarity around the 0-line for bias flips.
- Threshold bands (±1 by default): Optional gating for “strong” moves.
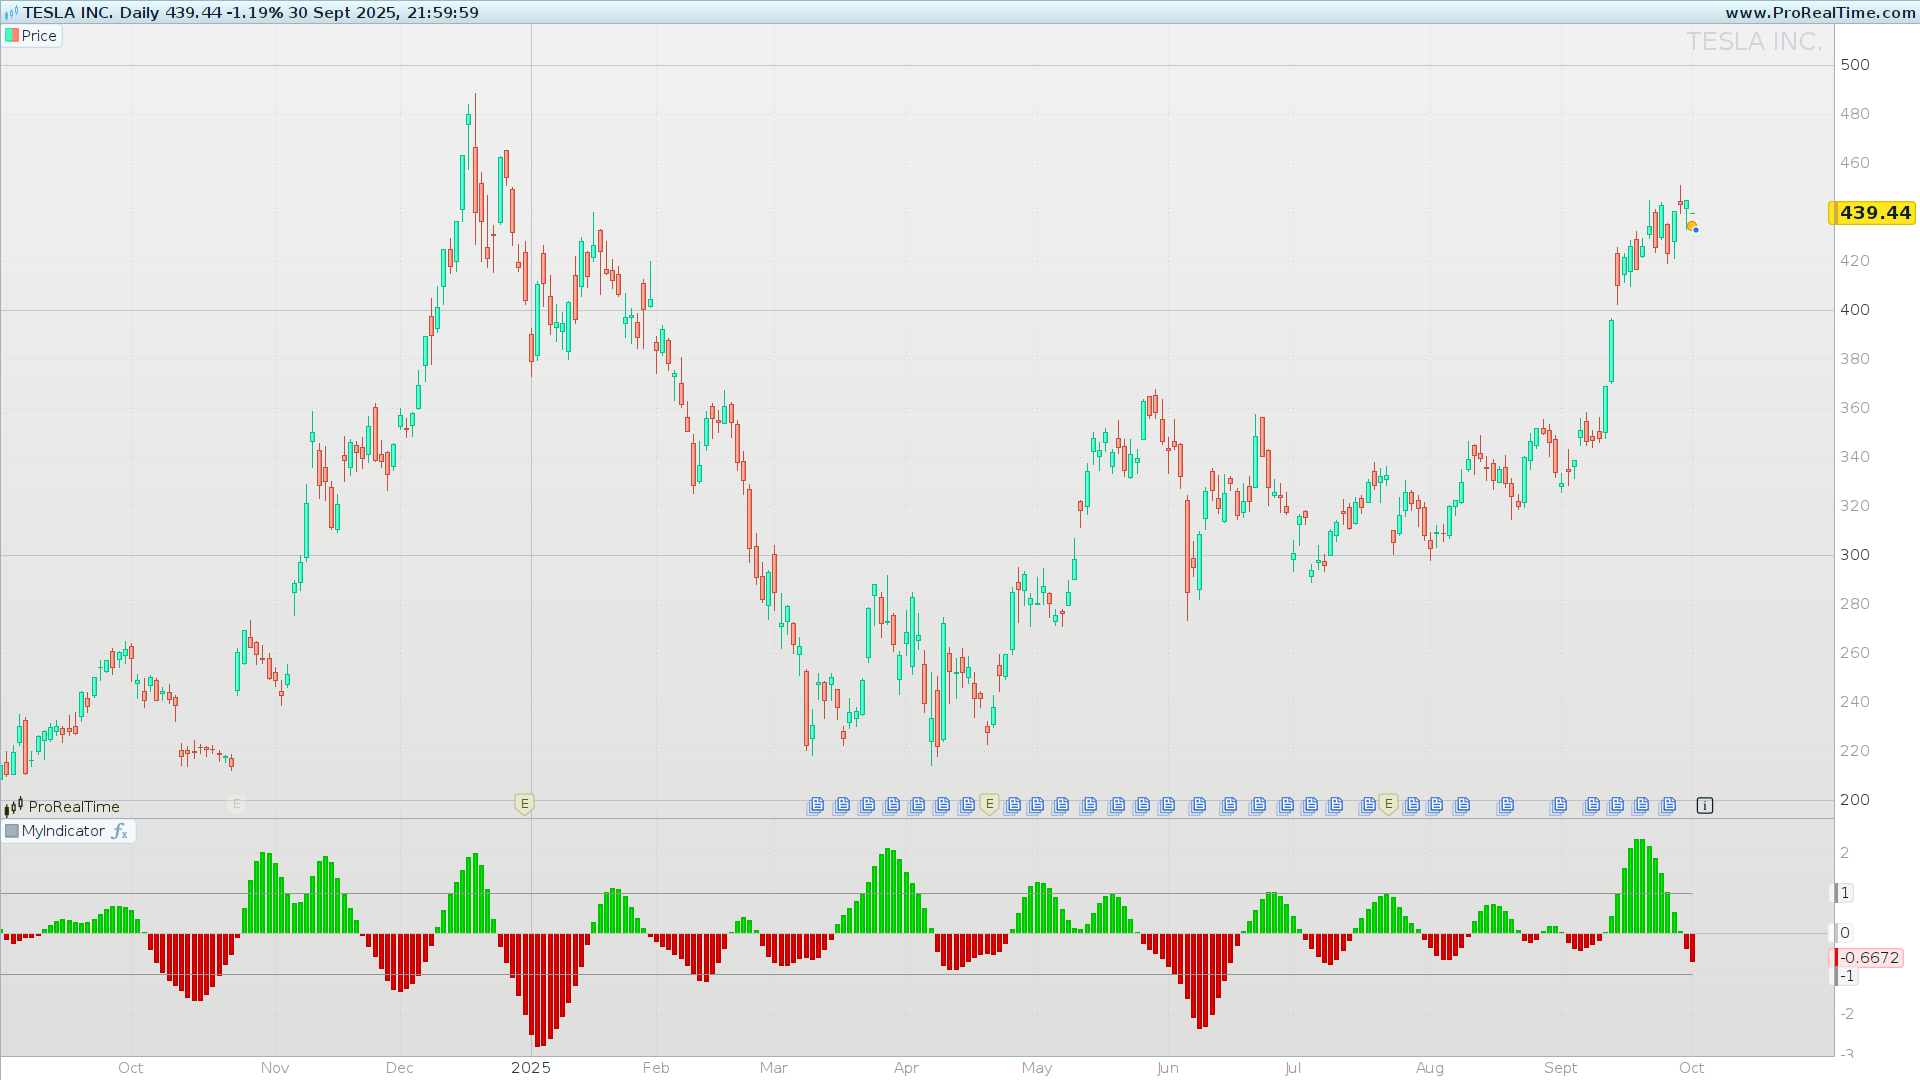
- Polarity coloring: Green above zero, red below, for instant read.
Intuition First: The Signal Pipeline
Price → remove trend with a 2nd-order High-Pass → reduce noise via 2nd-order Super Smoother → scale by RMS of recent energy → plot oscillator with zero line and ±thresholds.
- The HP filter strips slow drift so momentum flips are timely.
- The Super Smoother suppresses jitter without excessive lag.
- RMS normalization keeps values consistent, making ±1 a meaningful, portable reference.
Formula Breakdown
- High-Pass (2nd order)
- Frequency set by
hpPeriod. Coefficients useexp,cosand π to emulate a digital HP. - Output:
hp, removing low-frequency drift.
- Frequency set by
- Super Smoother (2nd order Low-Pass)
- Frequency set by
lpPeriod. Applied to the average ofhpandhp[1]to reduce phase noise. - Output:
lp, a smooth band-passed signal.
- Frequency set by
- RMS Normalization
- Compute rolling RMS over
rmsLenoflp². - Normalize:
osc = lp / max(rms, ε)so amplitude ≈ 1 in steady conditions.
- Compute rolling RMS over
- Display & Thresholds
- Plot
osc, zero line, and optional±threshold. - Dynamic color: green above zero, red below.
- Plot
Inputs & Defaults
hpPeriod= 30
Controls how aggressively drift is removed.- Shorter (15–25): faster bias flips, more whipsaws.
- Longer (35–50): steadier bias, slower to turn.
lpPeriod= 20
Governs smoothing of the high-pass output.- Shorter (10–16): snappier but noisier.
- Longer (22–30): calmer but laggier.
rmsLen= 100
Window for energy normalization.- Shorter (50–80): amplitude adapts quickly to volatility shifts.
- Longer (120–200): more stable scaling across regimes.
threshold= 1
Optional gating for “strong” moves.- Raise to 1.25–1.5 in choppy markets to reduce false positives.
- Lower to 0.7–0.9 to be more permissive.
How to Read the Oscillator
- Zero-line flips: Crossing above 0 suggests bullish momentum bias; below 0 suggests bearish.
- Threshold zones: Moves beyond
+thresholdor below-thresholdindicate stronger impulses. - Divergences: Price making new extremes while
oscfails to confirm often precedes momentum fades. - Regime awareness: In strong trends, pullbacks may stall near the zero line; in ranges, price mean-reverts around zero more frequently.
Tip: Treat ±threshold as context, not absolute signals. Combine with trend/volatility filters.
Trading Playbooks (Examples, Not Advice)
- Momentum Flip
- Entry: Bias flip through zero in trend direction (e.g., price above a slow MA, oscillator crosses > 0).
- Exit: First loss of momentum back through zero or trail with ATR.
- Use threshold: If the first push also clears
+threshold, allow a wider stop; otherwise, be tighter.
- Pullback Continuation
- Uptrend: After a dip above
-threshold, look foroscto curl back up and cross zero. - Downtrend: Mirror logic with +threshold.
- Idea: Avoid deeper counter-trend swings that pierce the opposite threshold.
- Uptrend: After a dip above
- Range Mean-Reversion
- In sideways regimes, fade moves that tag ±threshold when price is at range extremes.
- Exit near the zero line or mid-range.
Risk management: Always define invalidation (e.g., ATR-based stops or swing points) and position sizing before entries.
Best Practices & Common Pitfalls
- Don’t over-filter: Very long
hpPeriod + lpPeriodcan mute useful signals. - Keep RMS realistic: Too small
rmsLencan inflate amplitude after brief shocks. - Mind regime shifts: Re-tune
thresholdwhen volatility regime changes. - Use confirmations: Pair zero-cross ideas with a simple regime filter (e.g., MA slope) and a volatility filter (e.g., ATR percentile) to decide whether to run momentum or mean-reversion playbooks.
Code (ProBuilder)
// ====================================================
//PRC_Cybernetic Oscillator (John Ehlers, TASC 2025)
//version = 0
//01.10.25
//Iván González @ www.prorealcode.com
//Sharing ProRealTime knowledge
// ====================================================
// ----- Parámetros
hpPeriod = 30       // Periodo filtro Highpass
lpPeriod = 20       // Periodo filtro Lowpass (Super Smoother)
rmsLen   = 100      // Longitud RMS
threshold = 1       // Umbral opcional
// ----- Constantes
pi = 3.1415926535
sqrt2 = 1.41421356237
src = close
// ====================================================
// Calculos
// ====================================================
if barindex>=4 then
// ----- High-Pass Filter (2nd order)
a0 = sqrt2 * pi / hpPeriod
a1 = EXP(-a0)
c2hp = 2*a1*COS(a0*180/pi)
c3hp = -(a1*a1)
c1hp = (1 + c2hp - c3hp) * 0.25

hp = 0
hp = c1hp * (src - 2*src[1] + src[2]) + c2hp*hp[1] + c3hp*hp[2]

// ----- Super Smoother (Low-Pass, 2nd order)
a0lp = sqrt2 * pi / lpPeriod
a1lp = EXP(-a0lp)
c2lp = 2*a1lp*COS(a0lp*180/pi)
c3lp = -(a1lp*a1lp)
c1lp = 1 - c2lp - c3lp

lp = 0
lp = c1lp * 0.5*(hp + hp[1]) + c2lp*lp[1] + c3lp*lp[2]
endif
// ====================================================
// RMS Normalization
// ====================================================
pow2 = lp*lp
rms = SQRT(Average[rmsLen](pow2))
epsilon = 0.000001
den = MAX(rms, epsilon)

osc = lp / den
// ====================================================
// Líneas de referencia
// ====================================================
zeroline = 0
upth = threshold
lowth = -threshold
if osc > 0 then
red=0
green=255
blue=0
else
red=255
green=0
blue=0
endif
// ====================================================
RETURN osc AS "Cybernetic Osc" coloured(red,green,blue)style(histogram),zeroline COLOURED(200,200,200) AS "0",upth COLOURED(150,150,150) AS "+Threshold",lowth COLOURED(150,150,150) AS "-Threshold"