

CUSUM Trend
Introduction
Most trend indicators are reactive: they smooth price and wait for the smoothed line to turn. The CUSUM Trend indicator, originally published on TradingView by AlgoPoint, takes a fundamentally different route — it borrows a statistical tool from quality control (the Cumulative Sum test) and applies it to the residuals of a Hull Moving Average to detect when the market has persistently departed from its recent equilibrium.
The result is a regime detector that stays silent during noise and fires cleanly when price genuinely breaks away from its local centre of gravity. Combined with adaptive bands, a trailing stop and arrow signals, CUSUM Trend delivers a complete visual framework for identifying bullish, bearish and neutral regimes.
Theory Behind the Indicator
The Change-Point Detection Problem
A recurring question in any trend-following system is: has the market actually changed direction, or is this just noise? Classical moving-average crossovers answer this with a lag proportional to the MA length — useful in trending markets, costly in choppy ones.
CUSUM (Cumulative Sum) is a statistical process control test developed by E. S. Page in the 1950s to detect small, persistent shifts in the mean of a time series. Instead of comparing the current value against a threshold, it accumulates deviations above or below a reference point and fires only when the accumulated evidence exceeds a significance level.
The advantage: CUSUM is explicitly designed to detect persistent changes while ignoring isolated spikes. It is provably optimal for detecting abrupt mean shifts under Gaussian noise — exactly the problem a trend trader faces.
How CUSUM Is Applied Here
The indicator builds its statistical framework in three layers:
1. Baseline — Hull Moving Average
The HMA (of length baseLen) acts as the local reference. Instead of cumulating price itself, CUSUM operates on the residuals:
residual = close − HMA(baseLen)
Residuals are the deviation of price from its smoothed centre. In a stable regime, they oscillate around zero; in a regime shift, they develop a persistent bias.
2. Two one-sided CUSUM accumulators
Two separate cumulative sums track bullish and bearish pressure:
bullPressure += residual − kDrift
bearPressure += −residual − kDrift
The kDrift term (a fraction of the residuals’ standard deviation) is subtracted from every bar. This is the “dead zone” of the statistic: small residuals get eaten by the drift, but persistent ones accumulate faster than the drift can erode them. Each accumulator is clamped at zero (a negative value resets to zero) — a classic one-sided CUSUM design.
3. Dynamic threshold and regime change
When either accumulator exceeds a dynamic threshold hThresh = resStd × hMult, a regime change is declared:
- bullPressure > hThresh → regime = +1 (bullish)
- bearPressure > hThresh → regime = −1 (bearish)
Both accumulators reset on a trigger to prevent double firings. A regime ends only when price crosses the opposite band — this asymmetry is what keeps the indicator from flip-flopping.
The whole construction is elegant: the drift filters noise, the cumulative sum integrates evidence, and the threshold scales with the market’s own variability.
Key Features at a Glance
| Feature | Behaviour |
|---------|-----------|
| Regime detector | CUSUM on HMA residuals |
| Regime output | +1 bullish / −1 bearish / 0 neutral |
| Adaptive bands | HMA ± (hMult × residual stdev) |
| Trailing stop | Opposite band to the current regime |
| Entry arrows | Drawn on regime transitions |
| Sensitivity preset | Fast / Balanced / Slow (single parameter) |
How to Read the Indicator
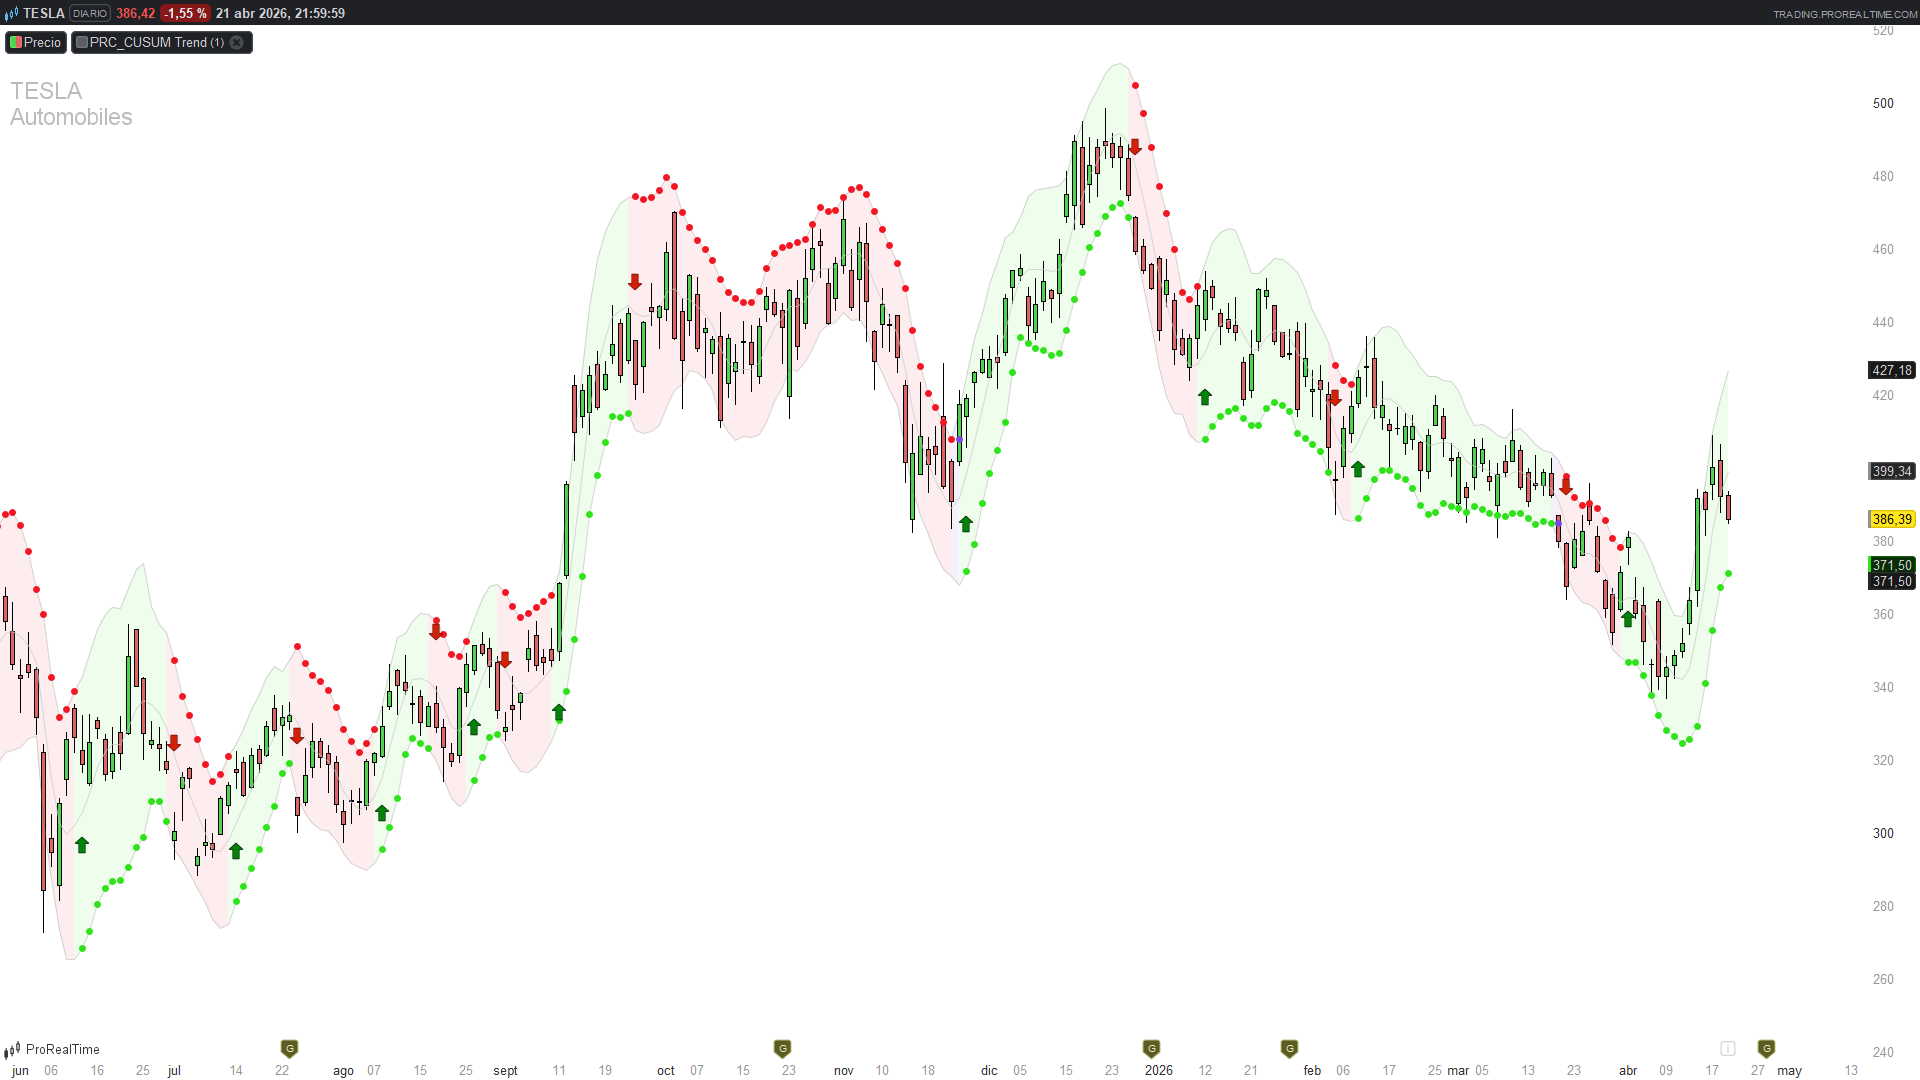
- Coloured cloud around the HMA — the shaded area between the upper and lower bands paints green during a bullish regime, red during a bearish one, and purple during neutral / unconfirmed regimes. This is your immediate regime read.
- Dotted trailing stop line — during an uptrend, the trailing stop sits at the lower band (below price); during a downtrend it sits at the upper band (above price). The stop is not a simple ATR trail — it is the statistical level at which the regime itself would be invalidated.
- Arrow signals — a green up-arrow below the low marks the first bar of a new bullish regime; a red down-arrow above the high marks the first bar of a new bearish regime. These are confirmed signals, not anticipations.
- HMA baseline — the grey line in the middle is the Hull MA used as the statistical reference. Useful for seeing the underlying smooth trend beneath the regime cloud.
Practical Applications
- Regime-filtered entries — only take long setups when the cloud is green, shorts when red. The purple (neutral) state is a stay-out zone.
- Statistical trailing stop — exit longs when price crosses below the lower band (the trailing stop during uptrend). Because the band is derived from residual volatility, it adapts to each market’s character without needing a per-instrument ATR multiplier tuning.
- Confirmation filter for breakout systems — CUSUM fires on persistent moves, not single-bar spikes. A breakout that also coincides with a CUSUM regime flip is statistically meaningful; one that doesn’t may be a head-fake.
- Sensitivity as a timeframe translator — the sensitivity input (Fast / Balanced / Slow) adjusts baseLen, kMult and hMult together in a coherent way. Fast (14 / 0.4 / 2.0) suits intraday; Slow (50 / 0.6 / 4.0) suits swing/position trading.
Indicator Configuration
| Parameter | Default | Description |
|-----------|---------|-------------|
| `sensitivity` | 2 | 1 = Fast (Day Trade), 2 = Balanced (Swing), 3 = Slow (Trend) |
| `baseLen` | 21 | HMA length (derived from sensitivity) |
| `kMult` | 0.5 | Drift multiplier — higher = more noise filtering |
| `hMult` | 3.0 | Threshold multiplier — higher = fewer but more significant signals |
The three sensitivity presets are coherent combinations: you don’t tune them individually. If you need custom values, edit the if sensitivity = … block directly.
Implementation Notes
Translating CUSUM to ProBuilder exposed a few subtleties worth documenting.
1. Persistent accumulators with once + warm-up. Pine’s var float bullPressure = 0.0 initialises once and is reassigned with :=. The ProBuilder equivalent is:
once bullPressure = 0
But once alone is not enough. During the first baseLen + 2 bars, the HMA output is undefined, which would contaminate the accumulator on the very first computation. A warm-up block forces the accumulators (and the regime) to stay at zero until the HMA has valid data:
if barindex < baseLen + 2 then
bullPressure = 0
bearPressure = 0
regime = 0
else
// normal CUSUM logic
endif
Skipping this warm-up produces either undefined propagation or an indicator that never fires — both are silent failures that only show up after visual inspection.
2. Regime state machine with explicit carry-over. ProBuilder’s IF/ELSIF chains do not implicitly retain a variable’s previous value. If none of the conditions fire, the regime must be explicitly carried forward:
elsif …
else
regime = regime[1]
endif
Without this final else, the regime would silently become undefined on every bar that doesn’t trigger — and the whole logic collapses.
3. Inline reset on trigger. When the threshold is crossed, both the regime assignment and the accumulator reset happen in the same if block:
if bullPressure > hThresh then
regime = 1
bullPressure = 0
bearPressure = 0
endif
This prevents double firings on consecutive bars when the accumulator remains above threshold after the first signal.
4. Division-by-zero protection. When price is perfectly flat, residuals are zero, their standard deviation is zero, and kDrift / hThresh collapse. A simple guard keeps the indicator well-defined on flat markets:
if resStd <= 0 then
resStd = 0.001
endif
5. What was lost from the original. Three elements of the Pine version do not have a clean ProBuilder equivalent and were dropped:
- The dashboard panel (Market State / Breakout Pressure / Trailing Stop) — ProBuilder has no native tables. The trailing stop is still drawn on the chart, so the information is not lost, just not summarised.
- The gradient bar colouring based on CUSUM pressure intensity — simplified to a fixed colour per regime. Only the visual encoding of “how close are we to firing” is lost.
- The JSON webhook alert payloads — in ProRealTime, alerts are set up from the UI on the bullStart / bearStart conditions. No JSON customisation.
Code
//---------------------------------------------------------//
// PRC_CUSUM Trend [AlgoPoint]
// version = 0
// 20.04.2026
// Iván González @ www.prorealcode.com
// Sharing ProRealTime knowledge
//---------------------------------------------------------//

// ==========================================
// 1. PARAMETROS
// ==========================================
// sensitivity: 1 = Fast, 2 = Balanced, 3 = Slow
sensitivity = 2

IF sensitivity = 1 THEN
   baseLen = 14
   kMult = 0.4
   hMult = 2.0
ELSIF sensitivity = 3 THEN
   baseLen = 50
   kMult = 0.6
   hMult = 4.0
ELSE
   baseLen = 21
   kMult = 0.5
   hMult = 3.0
ENDIF

// ==========================================
// 2. HMA Y RESIDUALES
// ==========================================
hmaBase = HullAverage[baseLen](close)
residual = close - hmaBase
resStd = STD[baseLen](residual)

IF resStd <= 0 THEN
   resStd = 0.001
ENDIF

kDrift = resStd * kMult
hThresh = resStd * hMult

upBand = hmaBase + hThresh
dnBand = hmaBase - hThresh

// ==========================================
// 3. MOTOR CUSUM (con warm-up)
// ==========================================
once bullPressure = 0
once bearPressure = 0
once regime = 0

IF barindex < baseLen + 2 THEN
   // Warm-up: evitar contaminar con undefined mientras HMA no tiene datos
   bullPressure = 0
   bearPressure = 0
   regime = 0
ELSE
   newBull = bullPressure[1] + residual - kDrift
   newBear = bearPressure[1] - residual - kDrift

   IF newBull > 0 THEN
      bullPressure = newBull
   ELSE
      bullPressure = 0
   ENDIF

   IF newBear > 0 THEN
      bearPressure = newBear
   ELSE
      bearPressure = 0
   ENDIF

   // Disparo y transporte del regimen
   IF bullPressure > hThresh THEN
      regime = 1
      bullPressure = 0
      bearPressure = 0
   ELSIF bearPressure > hThresh THEN
      regime = -1
      bullPressure = 0
      bearPressure = 0
   ELSIF regime[1] = 1 AND close < dnBand THEN
      regime = 0
   ELSIF regime[1] = -1 AND close > upBand THEN
      regime = 0
   ELSE
      regime = regime[1]
   ENDIF
ENDIF

// ==========================================
// 4. SENALES DE ENTRADA
// ==========================================
bullStart = regime = 1 AND regime[1] <> 1
bearStart = regime = -1 AND regime[1] <> -1

atrOffset = AverageTrueRange[30] * 1.05

IF bullStart THEN
   DRAWARROWUP(barindex, low - atrOffset) COLOURED(1, 130, 8, 255)
ENDIF
IF bearStart THEN
   DRAWARROWDOWN(barindex, high + atrOffset) COLOURED(209, 34, 8, 255)
ENDIF

// ==========================================
// 5. VISUALIZACION
// ==========================================
IF regime = 1 THEN
   rCol = 46
   gCol = 227
   bCol = 25
ELSIF regime = -1 THEN
   rCol = 243
   gCol = 22
   bCol = 35
ELSE
   rCol = 127
   gCol = 73
   bCol = 222
ENDIF

ColorBetween(upBand, dnBand, rCol, gCol, bCol, 20)

IF regime = 1 THEN
   trailStop = dnBand
ELSIF regime = -1 THEN
   trailStop = upBand
ELSE
   trailStop = undefined
ENDIF

RETURN upBand COLOURED(120, 120, 120, 80) AS "Upper Band", dnBand COLOURED(120, 120, 120, 80) AS "Lower Band", trailStop COLOURED(rCol, gCol, bCol, 255) STYLE(point, 3) AS "Trailing Stop", hmaBase COLOURED(200, 200, 200, 180) AS "HMA Base"
