

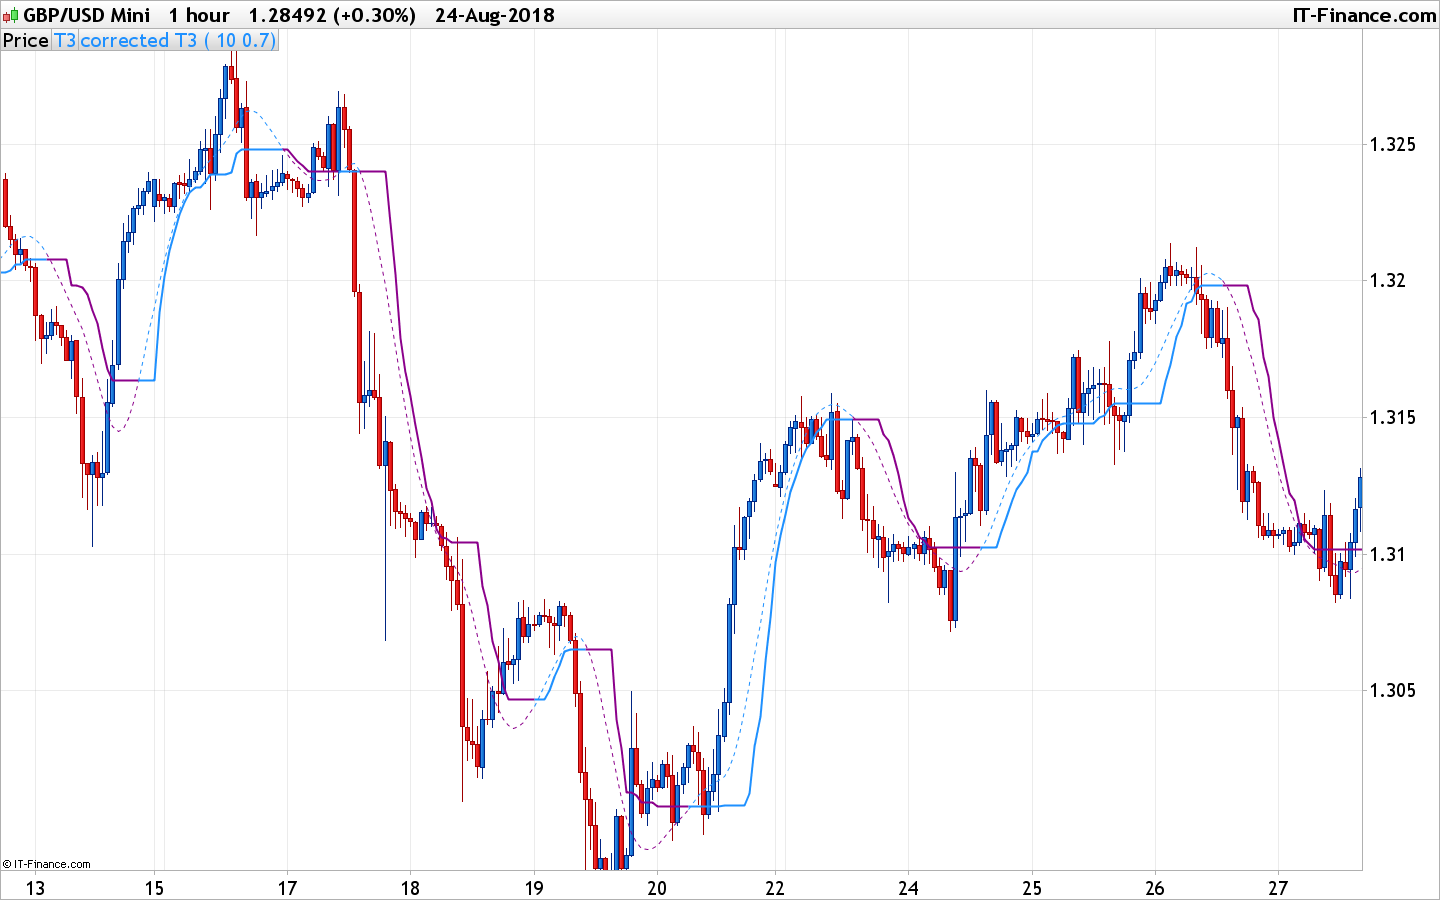
Corrected T3 average
August 25, 2018, 5:03 PM
Indicators
0 Comments
This is the corrected version of the T3 moving average. This function measure deviations of the T3 values if the changes are not significant, then the value is “flattened”. So it can be used to spot ranging market or potential reversal zones.
//PRC_Corrected T3 | indicator
//25.08.2018
//Nicolas @ www.prorealcode.com
//Sharing ProRealTime knowledge
//original idea from mladen (MT5 indi)

// --- settings
inpPeriod = 10 // Period
Hot    = 0.7 // T3 hot ({-1.5..1.5})
// --- end of settings

// T3
price  = customclose  // Price
Period = MAX(inpPeriod, 1)

if barindex>Period then
 e1 = ExponentialAverage[Period](price)
 e2 = ExponentialAverage[Period](e1)
 e3 = ExponentialAverage[Period](e2)
 e4 = ExponentialAverage[Period](e3)
 e5 = ExponentialAverage[Period](e4)
 e6 = ExponentialAverage[Period](e5)

 b = Hot
 b2 = (b * b)
 b3 = (b * b * b)

 c1 = -b3
 c2 = (3 * b2) + (3 * b3)
 c3 = (-6 * b2) - (3 * b) - (3 * b3)
 c4 = 1 + (3 * b) + b3 + (3 * b2)

 avg = c1 * e6 + c2 * e5 + c3 * e4 + c4 * e3

 //Corrected function
 n=Period
 SA = avg
 v1 = SQUARE(STD[n](close))
 v2 = SQUARE(CA[1]-SA)

 if(v2<v1) then
  k=0
 else
  k=1-v1/v2
  CA=CA[1]+K*(SA-CA[1])
 endif

 //color
 r=139
 g=0
 b=139
 if avg>CA then
  r=30
  g=144
  b=255
 endif

endif

return avg coloured(r,g,b) style(dottedline,1)  as "T3", ca coloured(r,g,b) style(line,2) as "corrected T3"
Download
Filename:
PRC_Corrected-T3.itf
Downloads:
247
Master
I created ProRealCode because I believe in the power of shared knowledge. I spend my time coding new tools and helping members solve complex problems.
If you are stuck on a code or need a fresh perspective on a strategy, I am always willing to help. Welcome to the community!
Author’s Profile
Loading...