

Composite Momentum
December 7, 2016, 10:24 AM
Indicators
1 Comment
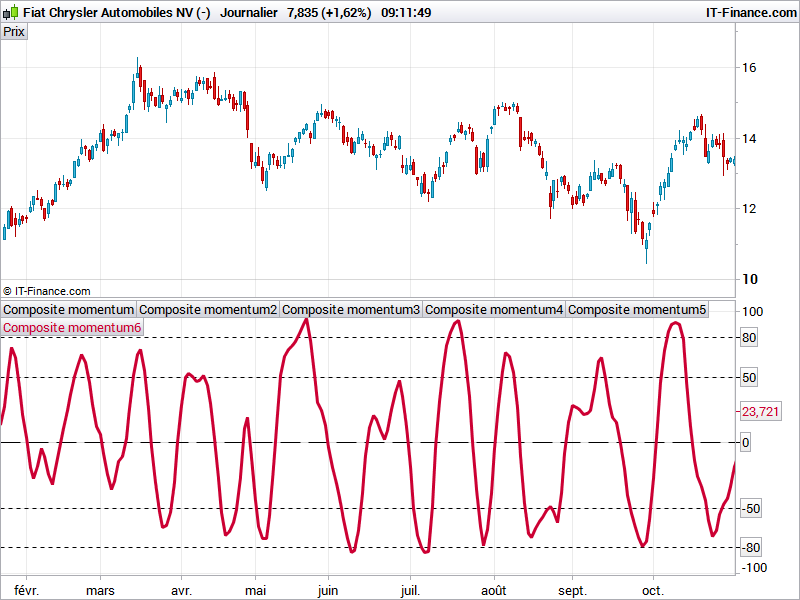
I found this Composite Momentum indicator code in an Italian forum recently. It has raise some interest over years, so that’s why I add it to the Library. This oscillator seems quite interesting for picking stock that show recent momentum raise.
To buy stocks, the author identify the lowest levels of the indicator to be the “opportunity zone”, between -80 to -50, while the highest levels are the dangerous zone to avoid initiate new long orders on market.
k=4
media1=average[3](Close)
media2=average[9](close)
Mom=exponentialaverage[1]((media1-media2)/media1)*100

diffMOM=MOM-MOM[1]
If MOM>MOM[1] then
 temp1=diffMOM
else
 temp1=0
endif
If MOM<MOM[1] then
 temp2=diffMOM
else
 temp2=0
endif

sumtemp1=summation[5](temp1)
sumtemp2=summation[5](temp2)
abssumdiff=summation[5](abs(diffMOM))

aa=((sumtemp1[1]-(sumtemp1[1]/5)+temp1)/(abssumdiff[1]-(abssumdiff[1]/5)+abs(diffmom))*100)
bb=((sumtemp2[1]-(sumtemp2[1]/5)+temp2)/(abssumdiff[1]-(abssumdiff[1]/5)+abs(diffmom))*100)
cc=aa-abs(bb)
key=ExponentialAverage[3](cc)

k=((close-lowest[5](low))/(highest[5](high)-lowest[5](low)))*100
d=average[3](k)

xtl=WeightedAverage[3](d)*2-100

Composite=WeightedAverage[2]((2*key+xtl)/3)

l1=50
l2=-50
linea1=80
linea2=-80
linea3=0

return linea1,linea2,linea3,l1,l2,Composite
Download
Filename:
Composite-momentum.itf
Downloads:
312
Master
I created ProRealCode because I believe in the power of shared knowledge. I spend my time coding new tools and helping members solve complex problems.
If you are stuck on a code or need a fresh perspective on a strategy, I am always willing to help. Welcome to the community!
Author’s Profile
Loading...