

Channel Volatility
August 30, 2020, 6:51 PM
Indicators
2 Comments
This indicator is calculated in the same way as Bollinger Bands.
However, it is based on an average of the last 9-26-52 periods, inspired by ichimoku.
The calculated standard deviation is 1
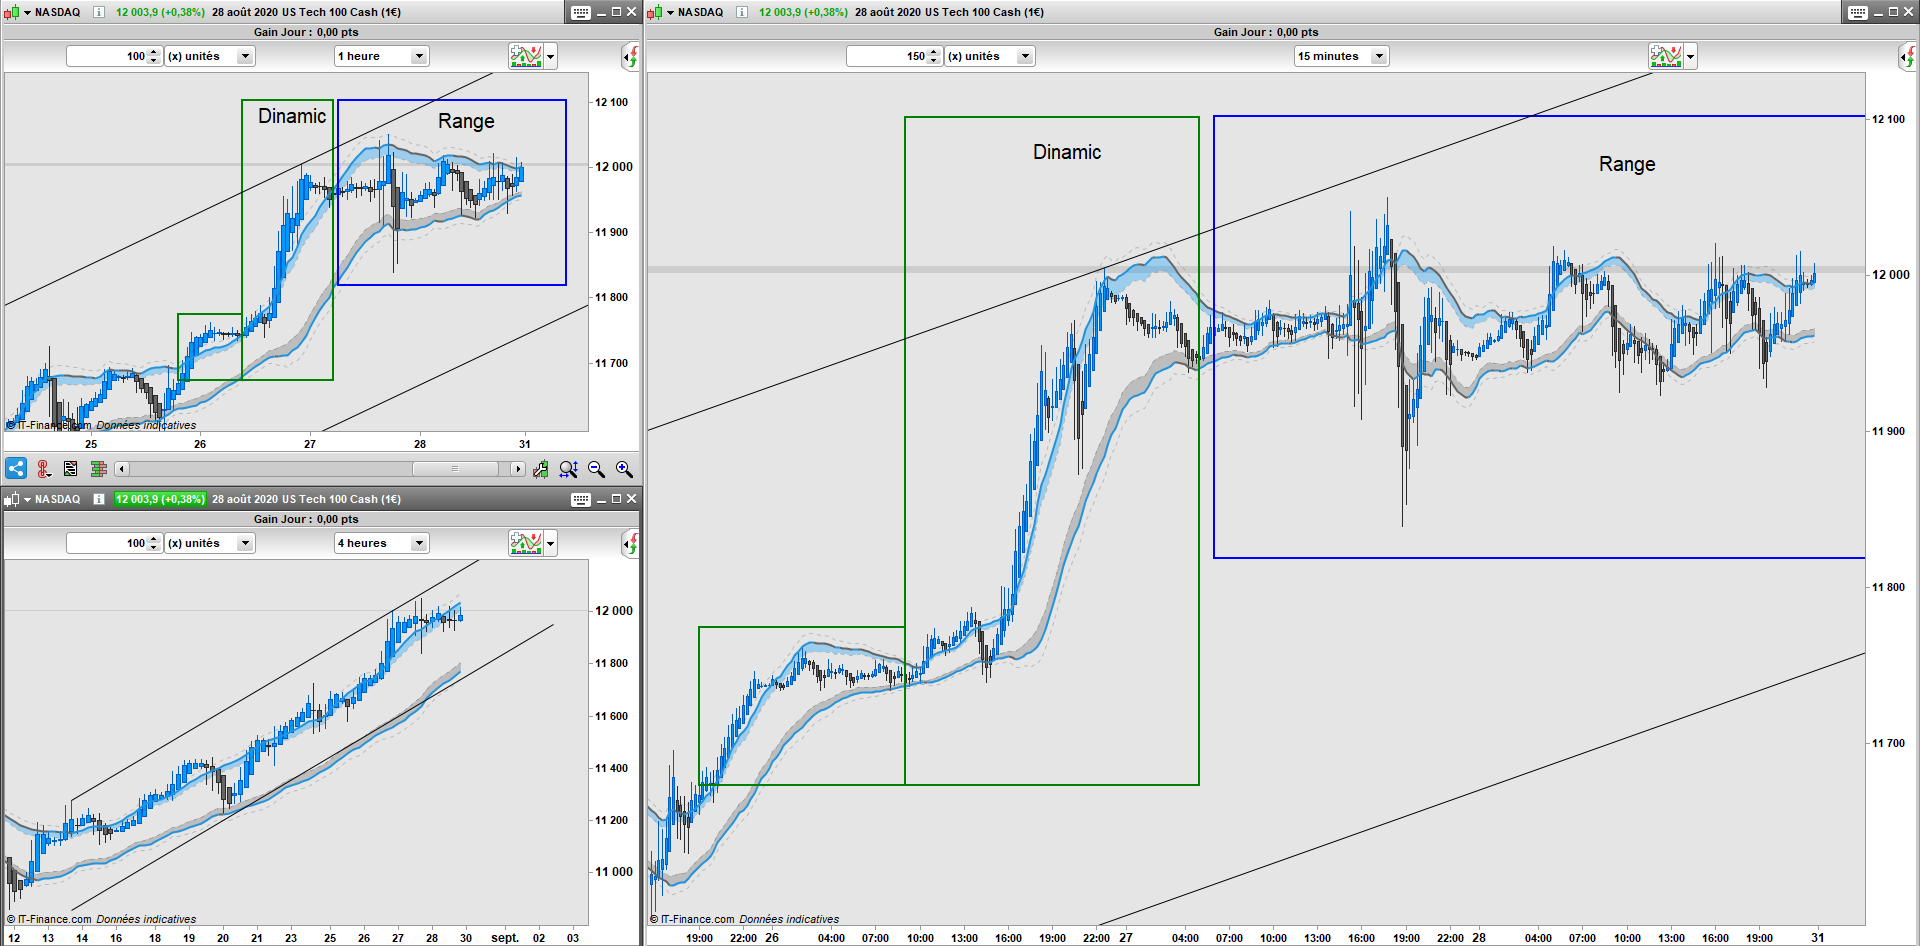
Its objective is to highlight dynamic or non-dynamic phases of the process.
If the price is within the bands over the long term, then a range is likely to be observed over the short term.
The dynamic phases will take place outside the bands in accordance with the long term.
Yours sincerely
IV
//
//==================== Indicateur

MM = average[20](close)

Bolup1 = MM+STD[9]*1.0
Boldw1 = MM-STD[9]*1.0
Bolup2 = MM+STD[26]*1.0
Boldw2 = MM-STD[26]*1.0
Bolup3 = MM+STD[52]*1.0
Boldw3 = MM-STD[52]*1.0
Bolup = (Bolup1+Bolup2+Bolup3)/3
Boldw = (Boldw1+Boldw2+Boldw3)/3

Bolup11 = MM+STD[9]*1.25
Boldw11 = MM-STD[9]*1.25
Bolup22 = MM+STD[26]*1.25
Boldw22 = MM-STD[26]*1.25
Bolup33 = MM+STD[52]*1.25
Boldw33 = MM-STD[52]*1.25
Bolup1 = (Bolup11+Bolup22+Bolup33)/3
Boldw1 = (Boldw11+Boldw22+Boldw33)/3

Bolup111 = MM+STD[9]*0.75
Boldw111 = MM-STD[9]*0.75
Bolup222 = MM+STD[26]*0.75
Boldw222 = MM-STD[26]*0.75
Bolup333 = MM+STD[52]*0.75
Boldw333 = MM-STD[52]*0.75
Bolup2 = (Bolup111+Bolup222+Bolup333)/3
Boldw2 = (Boldw111+Boldw222+Boldw333)/3

if Bolup > Bolup[1] then
 RU = 36
 GU = 147
 BU = 219
elsif Bolup < Bolup[1] then
 RU = 101
 GU = 101
 BU = 101
endif

if Boldw > Boldw[1] then
 RD = 36
 GD = 147
 BD = 219
elsif Boldw < Boldw[1] then
 RD = 101
 GD = 101
 BD = 101
endif

return Bolup coloured(RU,GU,BU) style(line,2) as "ZoneAchat", Boldw coloured(RD,GD,BD) style(line,2) as "ZoneVente", Bolup1 coloured(73,73,73,70) style(dottedline,1) as "ZoneAchatSecondaire1", Boldw1 coloured(73,73,73,70) style(dottedline,1) as "ZoneVenteSecondaire1",Bolup2 coloured(73,73,73,70) style(dottedline,1) as "ZoneAchatSecondaire2", Boldw2 coloured(73,73,73,70) style(dottedline,1) as "ZoneVenteSecondaire2"
Download
Filename:
Channel-Volatility.itf
Downloads:
158
Master
------------------------------------Participating Encoder-----------------------------------
Author’s Profile
Loading...