

CCI + RSI in the same indicator
August 9, 2018, 3:25 PM
Indicators
0 Comments
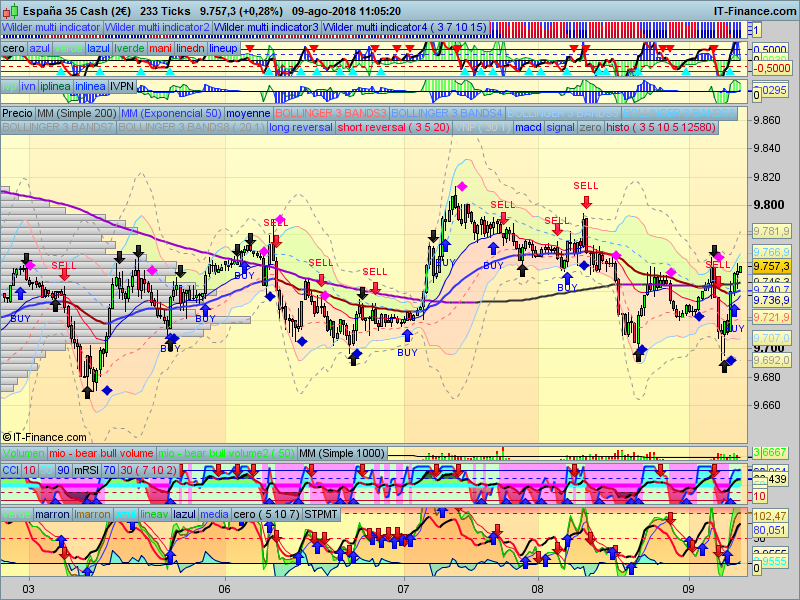
This indicator includes the 2 famous RSI and CCI oscillators into the same window.
You can change the period of CCI with “pcci” parameter and the RSI period with “prsi”.
The indicator also include a moving average of “mm” period over the 2 oscillators.
// Variables para daytrading:
pcci=10  //(periodo del CCI)
prsi=7 // (periodo del RSI)
mm = 10 // period of the Moving average

// "z" y "rs"=3 (factor suavizado curvas CCI y RSI)

z = CCI[pcci](close)*100/200+50
rs=RSI[prsi](close)

//Ajuste niveles superior/inferior del indicador (0 a 100)
if z>100 then
 z=100
endif
if z <0 then
 z=0
endif

// Medias para suavizar las curvas del CCI y RSI, si se desea

mcc=average[mm](z)
mmrs=average[mm](rs)

if 50 > mmrs then
 r=255
 g=0
 b=255
elsif 50 < mmrs then
 r=51
 g=255
 b=255
endif

if mcc crosses over 10 then
 drawarrowup(barindex,15) coloured(0,0,255)
endif

if mcc crosses under 90 then
 drawarrowdown(barindex,75) coloured(204,0,0)
endif

IF rs> 50  THEN
 backgroundcolor(204,255,204)
Else
 IF rs< 50  THEN
  backgroundcolor(255,153,255)
 ENDIF
endif

Return z as"CCI",rs as "RSI", 10 as "10",50 coloured(r,g,b) style(line,4) as "50", 90 as "90", mcc as "mCCI", mmrs as "mRSI", 70 as "70", 30 as "30"
Download
Filename:
CCI-and-RSI-same-chart.itf
Downloads:
591
Master
Developer by day, aspiring writer by night. Still compiling my bio... Error 404: presentation not found.
Author’s Profile
Loading...