

candle MTF on price
April 6, 2021, 9:15 AM
Indicators
12 Comments
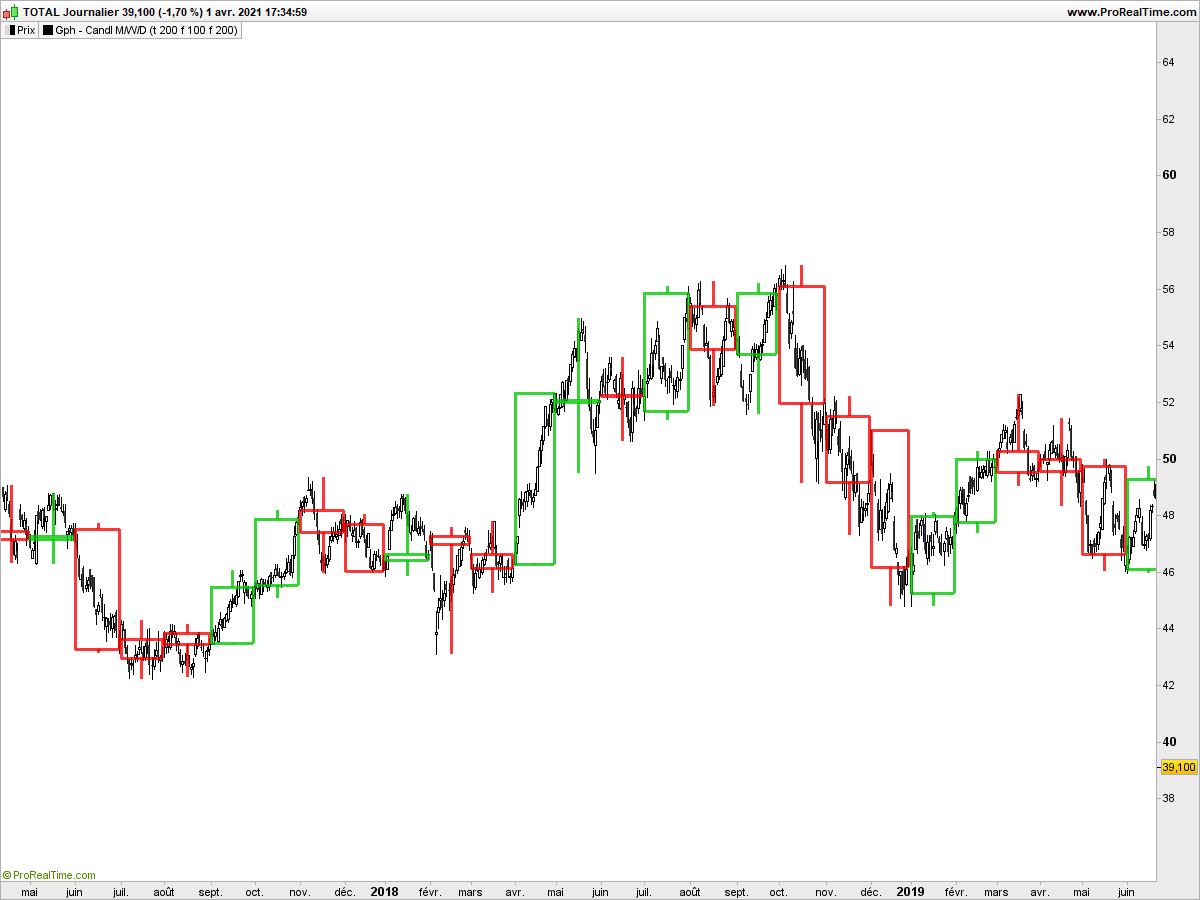
Indicator plots candlesticks of the desired timeframe (Monthly, Weekly, Daily) on the price chart.
Please download the attached itf file to get all the functionalities.
///////////////////////////////////// Var graph /////////////////////////////////////
v = 0
r = 0
/////////////////////////////////////////////////////////////////////////////////////////
if Mth then
if day[1]>day then
mhh = Highest[BarIndex - lastMonthBarIndex](High)[1]
mll = Lowest[BarIndex - lastMonthBarIndex](Low)[1]
lastMonthBarIndex = BarIndex
mstartbar = barindex
mo = dopen(BarIndex - lastMonthBarIndex)
mc = dclose(1)
mbmid = ((barindex-1)+mstartbar[1])/2

if mo[1]<mc then
v=200
elsif mo[1]>mc then
r=250
else
r=250
v=200
endif
if AlphaM>255 then
a = 255
elsif AlphaM<0 then
a = 0
else
a = AlphaM
endif
DRAWRECTANGLE(mstartbar[1],mo[1],barindex-1,mc)coloured(r,v,0,a)style(line,3)
DRAWSEGMENT(mbmid, max(mo[1],mc), mbmid, mhh)coloured(r,v,0,a)style(line,3)
DRAWSEGMENT(mbmid, min(mo[1],mc), mbmid, mll)coloured(r,v,0,a)style(line,3)
endif
endif
/////////////////////////////////////////////////////////////////////////////////////////
if wk then
if DayOfWeek[1] > DayOfWeek then
whh = Highest[BarIndex - wlastWeekBarIndex](High)[1]
wll = Lowest[BarIndex - wlastWeekBarIndex](Low)[1]
wlastWeekBarIndex = BarIndex
wstartbar = barindex
wo = dopen(BarIndex - wlastWeekBarIndex)
wc = dclose(1)
wbmid = ((barindex-1)+wstartbar[1])/2

if wo[1]<wc then
v=200
r=0
elsif wo[1]>wc then
v=0
r=250
else
r=250
v=200
endif
if AlphaW>255 then
a = 255
elsif AlphaW<0 then
a = 0
else
a = AlphaW
endif
DRAWRECTANGLE(wstartbar[1],wo[1],barindex-1,wc)coloured(r,v,0,a)style(line,2)
DRAWSEGMENT(wbmid, max(wo[1],wc), wbmid, whh)coloured(r,v,0,a)style(line,2)
DRAWSEGMENT(wbmid, min(wo[1],wc), wbmid, wll)coloured(r,v,0,a)style(line,2)
endif
Endif
/////////////////////////////////////////////////////////////////////////////////////////
IF Dy then
if intradaybarindex[1]>intradaybarindex then
jhh = Highest[BarIndex - lastdaybarindex](High)[1]
jll = Lowest[BarIndex - lastdaybarindex](Low)[1]
lastdaybarindex = BarIndex
jstartbar = barindex
jo = dopen(BarIndex - lastdaybarindex)
jc = dclose(1)
jbmid = ((barindex-1)+jstartbar[1])/2

if jo[1]<jc then
v=200
elsif jo[1]>jc then
r=250
else
r=250
v=200
endif
if AlphaD>255 then
a = 255
elsif AlphaD<0 then
a = 0
else
a = AlphaD
endif
DRAWRECTANGLE(jstartbar[1],jo[1],barindex-1,jc)coloured(r,v,0,a)style(line,4)
DRAWSEGMENT(jbmid, max(jo[1],jc), jbmid, jhh)coloured(r,v,0,a)style(line,4)
DRAWSEGMENT(jbmid, min(jo[1],jc), jbmid, jll)coloured(r,v,0,a)style(line,4)
endif
endif
/////////////////////////////////////////////////////////////////////////////////////////
return
Download
Filename:
Gph-Candle-MWD.itf
Downloads:
443
Average
As an architect of digital worlds, my own description remains a mystery. Think of me as an undeclared variable, existing somewhere in the code.
Author’s Profile
Loading...