

CAGR, Max Drawdown, and Calmar Ratio Indicator
Introduction
When evaluating the effectiveness of an investment or trading strategy, it is not enough to simply observe whether the price has risen or fallen between two dates. There are metrics that allow for a much more complete assessment of risk-adjusted performance. This indicator for ProRealTime calculates three of the most relevant metrics in this regard:
- CAGR (Compound Annual Growth Rate), which measures the annualized growth rate of an investment.
- Maximum Drawdown (MaxDD), which measures the largest drop from a peak to a trough.
- Calmar Ratio, which relates the compound annual growth rate to the maximum risk taken.
These three combined indicators allow the trader or investor to understand not only how much an investment has grown, but also how volatile or risky that growth has been.
This is a very useful tool for both retrospective analysis and comparing different strategies. It is especially designed for use in visual backtesting studies or long-term portfolio analysis.
How the Indicator Works
This indicator performs its calculations based on two points in time: a start date/time and an end date/time. From these two points, it retrieves the corresponding closing prices, and with this information, it calculates the three key metrics.
CAGR (Compound Annual Growth Rate)
CAGR indicates the rate at which the investment would have had to grow consistently to go from the initial value to the final value over the analyzed period. It is calculated using the formula:
CAGR = [(Final Value / Initial Value) ^ (1 / years)] - 1
Where the number of years is estimated based on the number of days (or equivalent bars) elapsed, adjusted to the chart’s timeframe (daily, weekly, monthly…).
Maximum Drawdown (MaxDD)
Maximum Drawdown measures the largest percentage drop from a local maximum to a subsequent minimum within the analyzed period. To calculate it, the indicator scans all the bars between the two selected dates, detects new highs, and then measures the deepest declines from those peaks.
Calmar Ratio
The Calmar Ratio is obtained by dividing the CAGR by the absolute value of the Maximum Drawdown. This metric evaluates how much return was achieved for each unit of risk taken (in terms of drawdown):
Calmar Ratio = CAGR / MaxDD
The higher this ratio, the more efficient the investment has been in terms of risk-adjusted return.
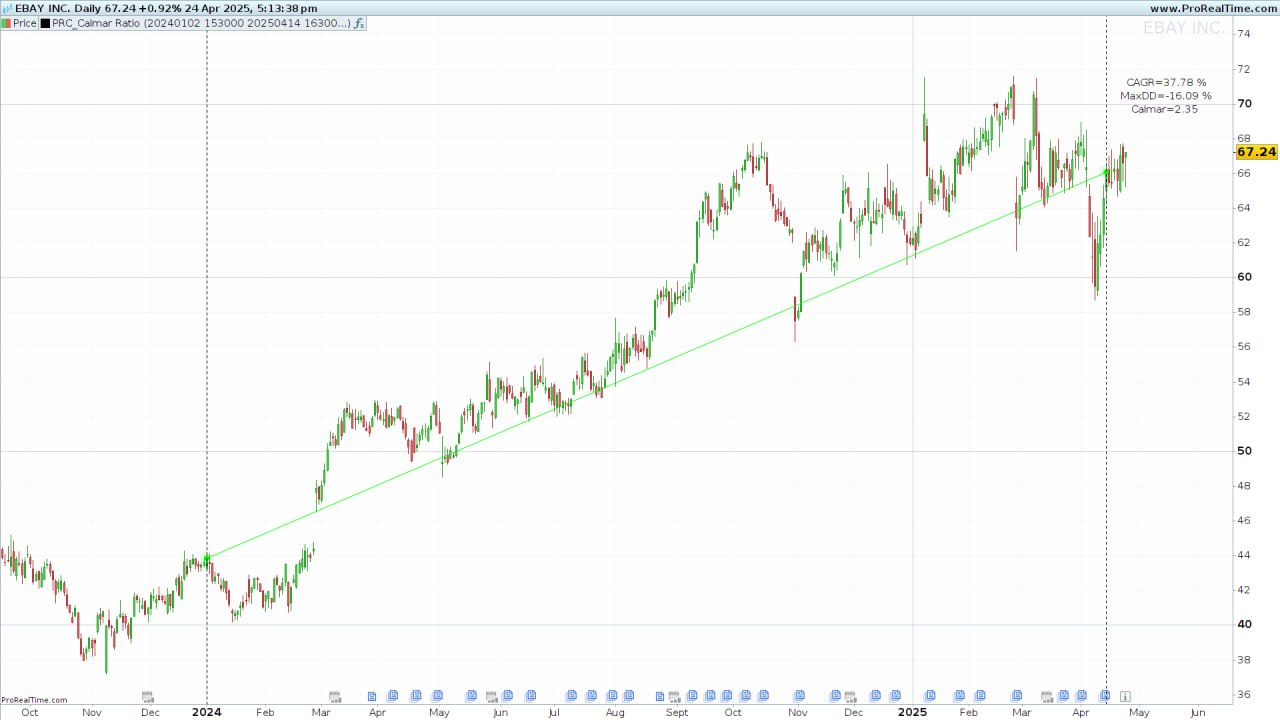
On-Chart Visualization
In addition to the numerical outputs, the indicator visually marks the selected points and paths on the chart for easy interpretation.
Graphical elements:
-
Start and End Points: Highlighted with circles, both semi-transparent and solid.
-
Connection Line: A line connecting both points to illustrate the trend direction.
-
Vertical Dotted Lines: Assist in locating the bars where the analysis starts and ends.
-
Text Outputs: Displayed in the top-right corner with the calculated CAGR, MaxDD, and Calmar Ratio.
Colors
-
Green: Used if the ending price is higher than the starting price.
-
Red: Used if the ending price is lower.
Warnings
-
“You need more than 1 day between 2 points”: Triggered when start and end dates are identical or the range is too short.
-
“Check the start date you entered…”: Displayed when there’s insufficient data or a market closure on the selected date.
Configuration Parameters
The indicator allows precise definition of the time interval to be analyzed through fixed variables in the code. These are the key parameters that must be manually configured by the user before applying the indicator to the chart:
Dates and Times
startDate: Start date of the analysis in YYYYMMDD format (e.g., 20250207).startTime: Start time in HHMMSS format (e.g., 100000 for 10:00:00).endDate: End date of the analysis.endTime: End time.
These parameters allow detailed control over the period to be analyzed, even on intraday timeframes. If working with daily or higher timeframes, the time values are ignored.
Usage Recommendations
- Ensure that data is loaded on the chart for the entire period between the two dates.
- Avoid selecting dates or times when the market is closed.
- Do not use the same value for both the start and end dates, as the calculation requires at least two distinct points in time.
Timeframe Compatibility
The indicator is designed to function correctly across all timeframes, from minutes to monthly. Depending on the timeframe, it automatically adjusts the data frequency to estimate elapsed years and calculate the CAGR:
- Monthly: Assumes 12 periods per year.
- Weekly: Assumes 52 periods per year.
- Daily or lower: Assumes 252 periods per year (trading days).
ProRealTime Code
Below is the full code to paste into the custom indicator editor in ProRealTime.
//-------------------------------------------------------//
//PRC_Calmar Ratio
//version = 0
//23.04.25
//Iván González @ www.prorealcode.com
//Sharing ProRealTime knowledge
//-------------------------------------------------------//
defparam drawonlastbaronly=true
//-----------------------------------------------//
// Inputs
//-----------------------------------------------//
startDate=20250207
startTime=100000
endDate=20250407
endTime=150000
//-----------------------------------------------//
// Calculate x1,y1 and x2,y2
//-----------------------------------------------//
tm = gettimeframe
if tm >= 86400 then
if opendate=startdate then
idxStart=barindex
ValueStart=close
endif
if opendate=endDate then
idxEnd=barindex
ValueEnd=close
endif
else
if opendate=startdate and opentime=startTime then
idxStart=barindex
ValueStart=close
endif
if opendate=endDate and opentime=endTime then
idxEnd=barindex
ValueEnd=close
endif
endif
if ValueEnd>ValueStart then
r=0
g=255
b=0
else
r=255
g=0
b=0
endif
//-----------------------------------------------//
// Draw and calculations
//-----------------------------------------------//
if startDate>=EndDate then
drawtext("You need more than 1 day between 2 points",0,-100)anchor(top,xshift,yshift)
elsif ValueStart=0 or ValueEnd=0 then
drawtext("Check the start date you entered. It might be that you don’t have enough bars loaded.Or maybe you entered a day/time when the market was closed",0,-100)anchor(top,xshift,yshift)
else
if islastbarupdate then
n1=barindex-idxStart
n2=barindex-idxEnd
//-----------------------------------------------//
drawpoint(idxStart,ValueStart,5)coloured(r,g,b,30)
drawpoint(idxEnd,ValueEnd,5)coloured(r,g,b,30)
drawpoint(idxStart,ValueStart,2)coloured(r,g,b)
drawpoint(idxEnd,ValueEnd,2)coloured(r,g,b)
drawsegment(idxStart,ValueStart,idxEnd,ValueEnd)coloured(r,g,b)
//-----------------------------------------------//
drawvline(barindex[n1])style(dottedline)
drawvline(barindex[n2])style(dottedline)
//-----------------------------------------------//
peak=ValueStart
maxDD=0
bars=0
for i=n1 downto n2 do
if tm>=86400 then
bars=bars+1
else
if openday<>openday[1] then
bars=bars+1
else
bars=bars
endif
endif
if close[i]>peak then
peak=close[i]
endif
dd=(peak-close[i])/peak*100
if dd>maxDD then
maxDD=dd
endif
next
//-----------------------------------------------//
//---Check timeframe for CAGR calculation--------//
if tm = 2592000 then //monthly timeframe
n = 12
elsif tm = 604800 then //weekly timeframe
n = 52
elsif tm <=86400 then //Other timeframes (daily or less)
n = 252
endif
iYears=bars/n
cagr = round((pow(ValueEnd/ValueStart,(1/iyears))-1)*100,2)
//-----------------------------------------------//
MaxDrawDown=round(-maxDD,2)
Calmar=round(cagr/maxDD,2)
drawtext("CAGR=#cagr#%",-100,-100)anchor(topright,xshift,yshift)
drawtext("MaxDD=#MaxDrawDown#%",-100,-120)anchor(topright,xshift,yshift)
drawtext("Calmar=#Calmar#",-100,-140)anchor(topright,xshift,yshift)
endif
endif
return
