

CAGR: Compound Annual Growth Rate
Introduction:
In financial analysis the Compound Annual Growth Rate (CAGR) and the growth rate help investors assess the performance of their assets over different periods. Today I want to share with you this code that can automate these calculations, offering a valuable tool for investment analysis.
Code Explanation:
The script we are discussing is designed to calculate the CAGR and growth rate of any asset over time. Here we break down its main components:
Definition of Inputs and Variables:
- FinValue and IniValue represent the final and initial value of the asset, respectively. They could be modified, but by default, they use all the loaded candles.
- period calculates the number of periods based on the time frame selected by the user, dynamically adjusting the calculation of the CAGR.
Calculation of the Number of Periods:
The script automatically adjusts the number of periods (period) depending on the chosen time frame, ensuring that the CAGR calculation is accurate for daily, weekly, or monthly data.
Adjustments According to the Time Frame:
The script distinguishes between time frames to determine how to present the data (days, weeks, months).
Calculation of CAGR and Growth Rate:
- The CAGR is calculated using a formula that normalizes growth to an annual period, allowing for comparison of investments of different durations.
- The growth rate shows the total percentage change from the initial value to the final value.
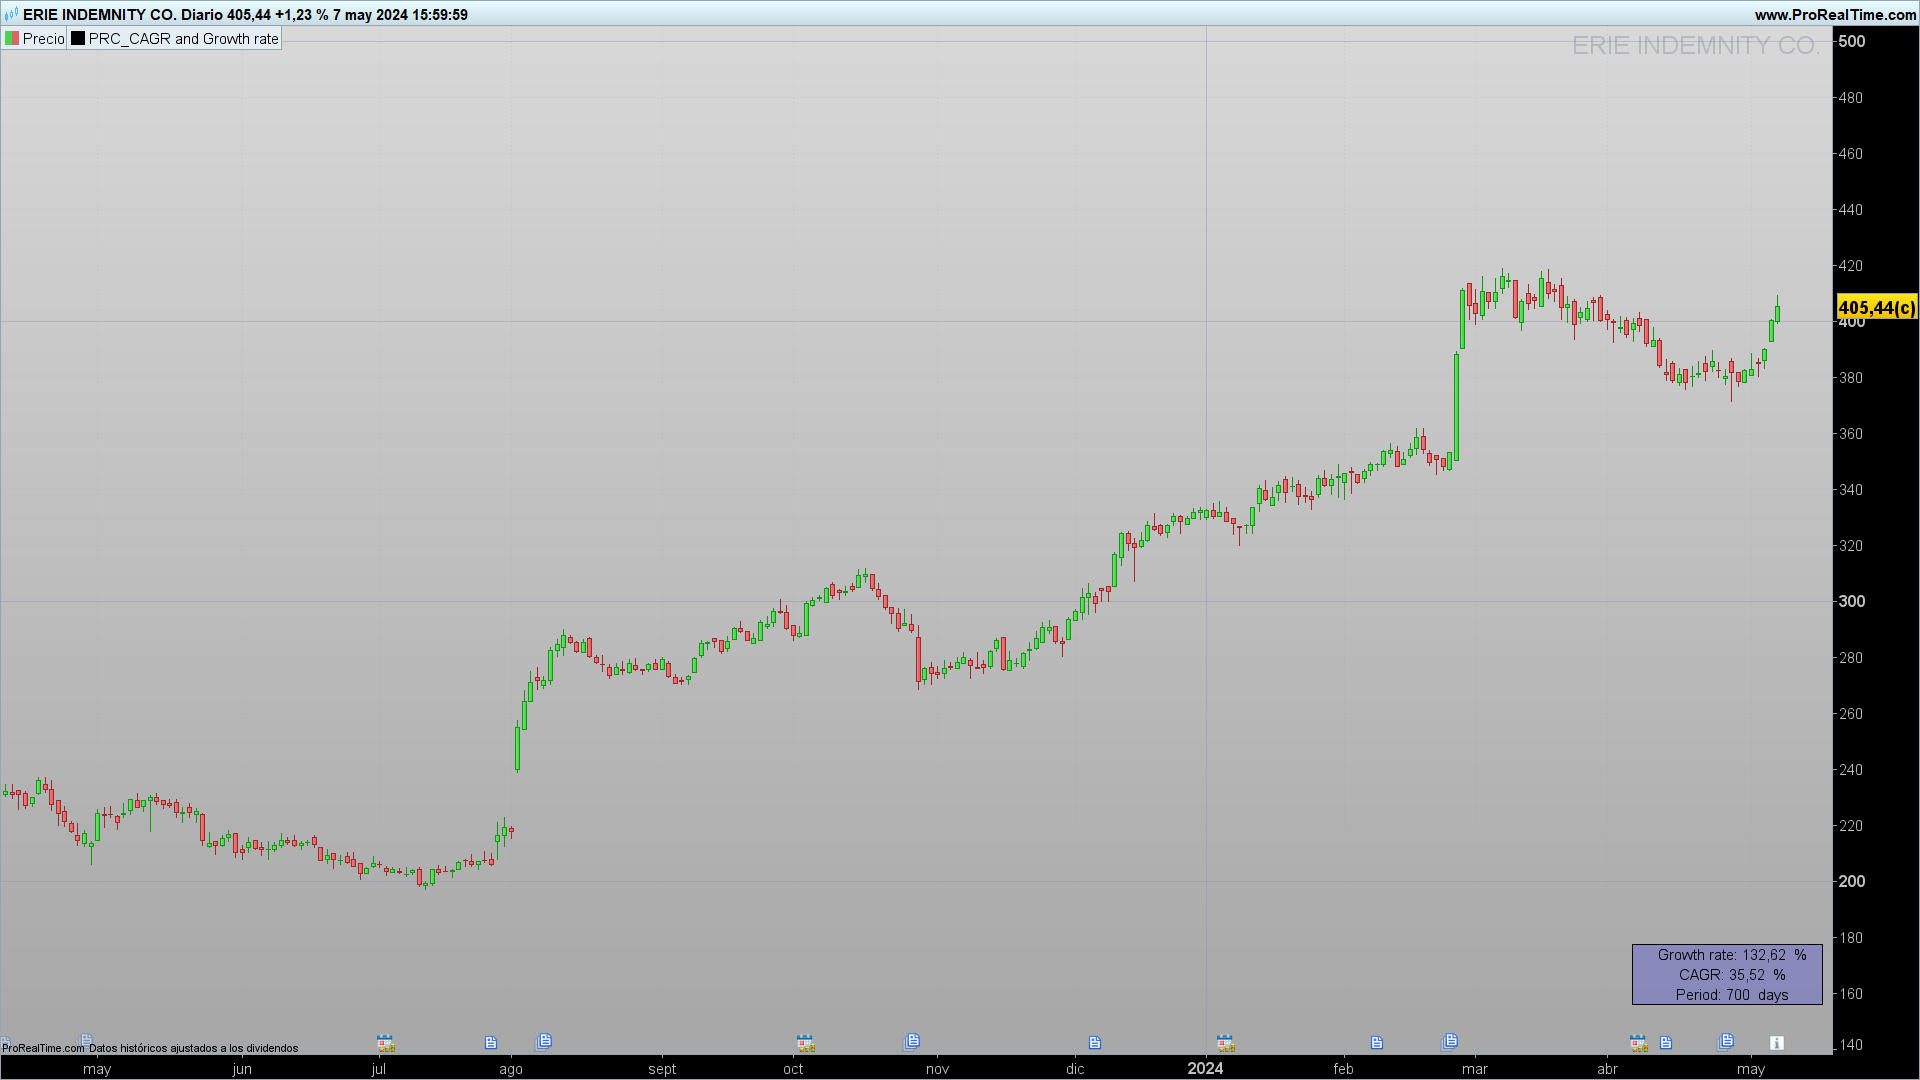
Visualization of the Results:
The script includes functions to display the results of CAGR and the growth rate on the screen, facilitating visual interpretation of the data.
How the Indicator Works:
The calculation of the CAGR is carried out using the formula:
CAGR=((FinValue/IniValue)^(n/period)−1)×100
where n represents the number of periods corresponding to a year according to the time frame. Specifically:
- For monthly time frames, n = 12 (12 months in a year).
- For weekly time frames, n = 52 (approximately 52 weeks in a year).
- For daily or shorter time frames, n = 252 (business days in a trading year). When the time frame is less than one day, the indicator first calculates the number of days elapsed and then determines the CAGR, thus ensuring that the evaluation of annual growth is precise and comparable. This methodology allows for a standardized evaluation of annual growth, facilitating the comparison between investments of different durations and with different data frequencies.
Practical Applications:
This indicator is particularly useful for investors who need to evaluate and compare the performance of different assets over time, regardless of market fluctuations and various investment periods.
Conclusion:
Understanding and calculating the CAGR and growth rate is fundamental in investment management. The script presented facilitates these calculations in ProRealTime. We encourage users to customize the code to suit their specific needs.
Code:
//-------------------------------------------------------//
//PRC_CAGR and Growth rate
//version = 1
//22.03.24
//Iván González @ www.prorealcode.com
//Sharing ProRealTime knowledge
//-------------------------------------------------------//
//-----Inputs--------------------------------------------//
defparam drawonlastbaronly = true
FinValue = Close[0]
IniValue = close[barindex]
//-------------------------------------------------------//
//-----Calculate number of periods-----------------------//
tm = gettimeframe
if tm > 86400 then
period = barindex
else
if day <> day[1] then
period = 1+period
else
period = period
endif
endif
//-------------------------------------------------------//
//---Check timeframe for CAGR calculation----------------//
if tm = 2592000 then //monthly timeframe
n = 12
drawtext("Period: #period# months",-100,+60)anchor(BOTTOMRIGHT ,XSHIFT ,YSHIFT )
elsif tm = 604800 then //weekly timeframe
n = 52
drawtext("Period: #period# weeks",-100,+60)anchor(BOTTOMRIGHT ,XSHIFT ,YSHIFT )
elsif tm <=86400 then //Other timeframes (daily or less)
n = 252
drawtext("Period: #period# days",-100,+60)anchor(BOTTOMRIGHT ,XSHIFT ,YSHIFT )
else
drawtext("Period: #period# bars",-100,+60)anchor(BOTTOMRIGHT ,XSHIFT ,YSHIFT )
endif
//-------------------------------------------------------//
//-----CAGR and Growth Rate------------------------------//
if barindex < n then
CAGR = undefined
else
CAGR = round((POW((FinValue/IniValue),(n/period))-1)*100,2)
GR = round((FinValue / IniValue - 1) * 100,2)
endif
//-------------------------------------------------------//
//-----Plot----------------------------------------------//
if tm=2592000 or tm=604800 or tm<=86400 then
drawtext("Growth rate: #GR# %",-100,100)anchor(BOTTOMRIGHT ,XSHIFT ,YSHIFT )
drawtext("CAGR: #CAGR# %",-100,+80)anchor(BOTTOMRIGHT ,XSHIFT ,YSHIFT )
drawrectangle(-200,110,-10,50)anchor(BOTTOMRIGHT ,XSHIFT ,YSHIFT )fillcolor("blue",50)
else
drawtext("Growth rate: #GR# %",-100,100)anchor(BOTTOMRIGHT ,XSHIFT ,YSHIFT )
drawrectangle(-200,110,-10,50)anchor(BOTTOMRIGHT ,XSHIFT ,YSHIFT )fillcolor("blue",50)
endif
//-------------------------------------------------------//
return
