

BUY & SELL PRESSURE XeLMod.
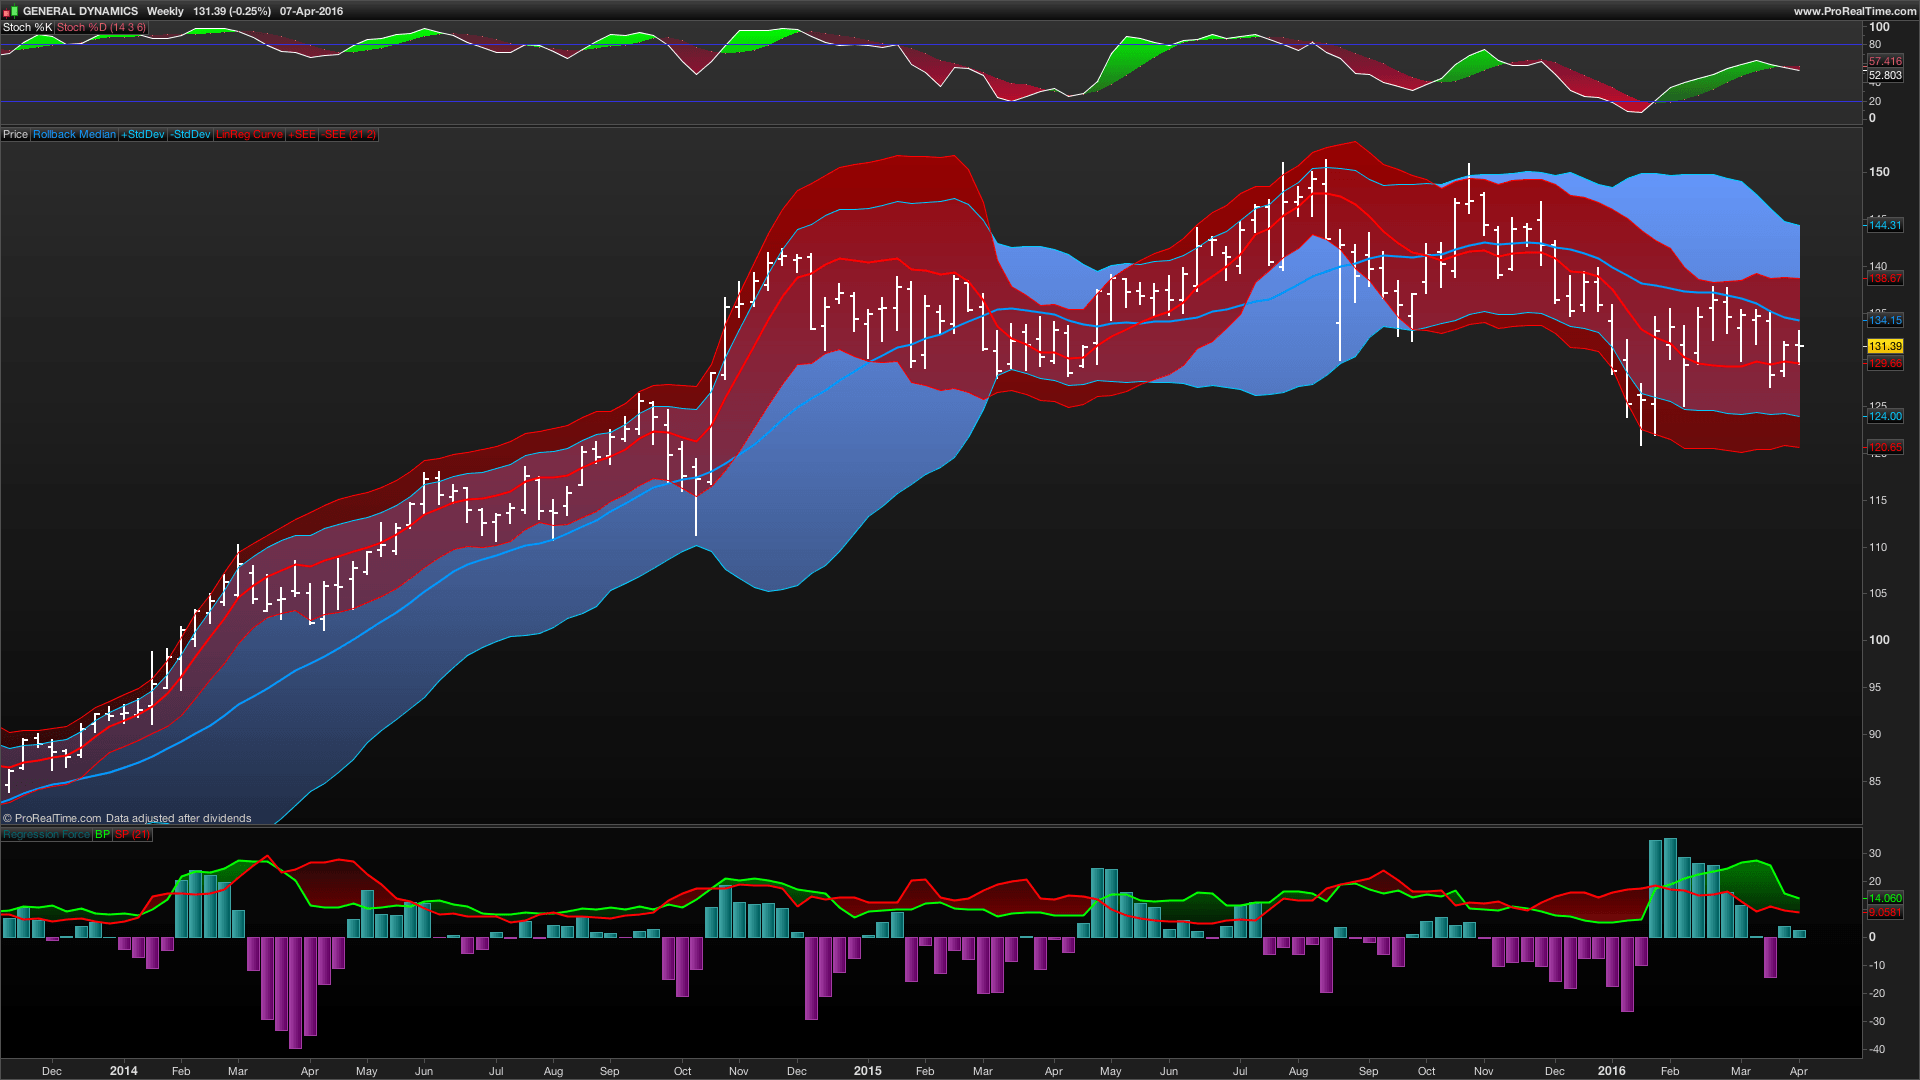
BUY & SELL PRESSURE Oscillator
Ver. 1.0 XelMod
WHAT’S THIS?
This is my first revision for ProBuilder of the original implementation for AmiBroker by Karthik Marar’s of it’s BUY AND SELL PRESSURE INDICATORS but this time, with an aditional REGRESSIVE ANALYSIS algorithm based in Rate Of Change (A kind of Slope but measured in % Performance).
The intention is to plot as Histogram the Force correlation of Buying Vs Selling Pressure geometrically weighted at each candle by Rate of Change method, wich gives a very fast reading of the trend and as a laggy confirmator instance, the oscillator lines given the same reading but based just in a Simple Averaging Approach (Karthik Marar’s original method).
This is an excelent momentum indicator very similar to ADX but in a candle weighting distribution rather than ranges.
For additional reference:
http://karthikmarar.blogspot.mx/2015/05/buy-and-sell-pressure-indicators.html
Cheers!
Any feedback will be welcome…
@XeL_Arjona
THE CODE:
P = 21
// Fixed Variables
Cl    = close
Hi    = high
Lo    = low
Vo    = volume
IF Vo = 0 THEN
Vo = 1
ENDIF
Hm    = max(Hi,Cl[1])
Lm    = min(Lo,Cl[1])
// XeL Rate Of Change MoD (Regressional)
SProc = abs((Hm-Cl)/Hm)
BProc = abs((Cl-Lm)/Lm)
SPprc = Hm-Cl
BPprc = Cl-Lm
BPa   = Average[P](BProc)
BPap  = Average[P](BPprc)
SPa   = Average[P](SProc)
SPap  = Average[P](SPprc)
BPn   = (BProc/BPa)*12
SPn   = (SProc/SPa)*12
BPnp  = (BPprc/BPap)*12
SPnp  = (SPprc/SPap)*12
Va    = Average[55](Vo)
Vn    = Vo/Va
BPo   = linearregression[9](BPn * Vn)
SPo   = linearregression[9](SPn * Vn)
nbf   = Average[9](BPnp * Vn)
nsf   = Average[9](SPnp * Vn)
lrBPh = (BPo - SPo)
// PLOT DIRECTIVES
RETURN lrBPh AS "Regression Force" , nbf COLOURED(0,255,0) AS "BP", nsf COLOURED(255,0,0) AS "SP"