

Britains percentage % stoploss
March 3, 2016, 1:43 PM
Indicators
2 Comments
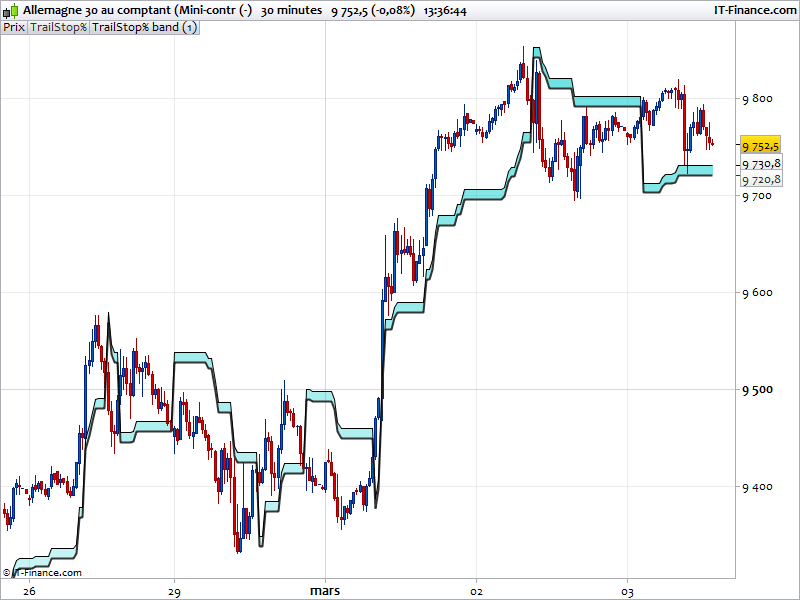
Nice and useful stoploss indicator placement. Similar to a “supertrend” a bit, as the price goes above or below the recent high/low plus or minus a percent to change direction.
I changed a bit the drawing to add a second line to act as a band, more visual indeed.
// TrailingStop%
// JWK, 20091016
//p=1
perc = p // input Trailing Loss % - median term: 5 - 10
longloss = high*perc/100
shortloss = low*perc/100

If high < shorttrail[1] and direction[1] = -1 then // staying short
  shorttrail = Min(shorttrail[1],low + shortloss)
  longtrail = Min(longtrail[1],high - longloss)
  plot = shorttrail
  direction = -1
elsif high > shorttrail[1] and direction[1] = -1 then // short stopped out, going long
  shorttrail = Max(shorttrail[1], low + shortloss)
  longtrail = high - longloss
  plot = longtrail
  direction = 1
elsif low > longtrail[1] and direction[1] = 1 then // staying long
  longtrail = Max(longtrail[1],high - longloss)
  shorttrail = Max(shorttrail[1], low + shortloss)
  plot = longtrail
  direction = 1
elsif low < longtrail[1] and direction[1] = 1 then // long stopped out, going short
  longtrail = Min(longtrail[1],high - longloss)
  shorttrail = low + shortloss
  plot = shorttrail
  direction = -1
else
  shorttrail = low + shortloss
 longtrail = high - longloss
  plot = longtrail
  direction = 1
endif

return plot AS "TrailStop%", plot+10*pipsize AS "TrailStop% band"
//indicator from Kevin Britains archive.
Download
Filename:
Britains-Stop.itf
Downloads:
107
Master
I created ProRealCode because I believe in the power of shared knowledge. I spend my time coding new tools and helping members solve complex problems.
If you are stuck on a code or need a fresh perspective on a strategy, I am always willing to help. Welcome to the community!
Author’s Profile
Loading...