

Bridge Bands
March 1, 2021, 10:51 AM
Indicators
10 Comments
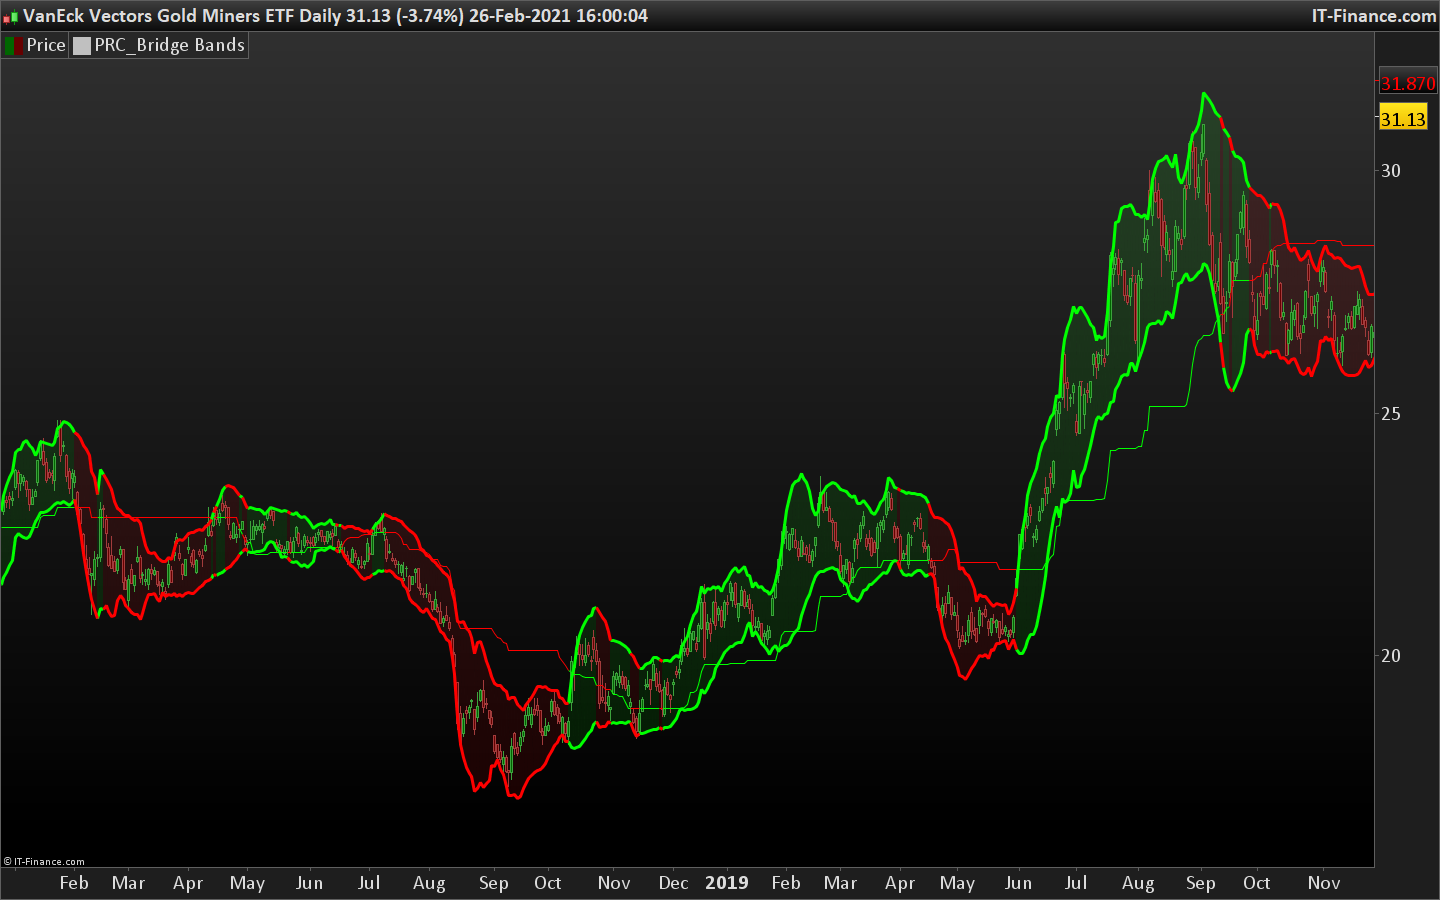
Bridge Bands are an implementation of the work done by Joe Catanzaro (joecat808) to produce a risk range for a security.
The basic idea is to calculate Mandelbrot’s “Bridge Range”. ( Pg . 179 of Misbehavior of Markets)
It then calculates Bollinger Bands .
Then next step is to calculate the Hurst Exponent .
The last step is to merge the Bridge Range and the Bollinger Bands . The basic concept is if H = .5 we use the Bollinger Bands and the farther away we move from .5 in either direction the Bridge Range takes more precedent.
There is a Trend value that is the mid-point of a 3 month Donchian Channel. If price is above we’re bullish , if price is below we’re bearish.
(description of original author: calebsandfort)
//PRC_Bridge Bands | indicator
//01.03.2021
//Nicolas @ www.prorealcode.com
//Sharing ProRealTime knowledge

// --- settings
length = 15 //Length
trendLength = 63 //Trend Length
resolution = 0 //Resolution
//topRiskRangePositionSizePtg = 25 //Top RR Position Size %
//midRiskRangePositionSizePtg = 75 //Mid RR Position Size %
//bottomRiskRangePositionSizePtg = 125 //Bottom RR Position Size %
// --- end of settings

//topRiskRangePositionSizePtg = topRiskRangePositionSizePtg/100
//midRiskRangePositionSizePtg = midRiskRangePositionSizePtg/100
//bottomRiskRangePositionSizePtg = bottomRiskRangePositionSizePtg/100

timeframe(daily,updateonclose)
securityclose = close[resolution]
securityhigh = high[resolution]
securitylow = low[resolution]

lengthMinus1 = length - 1

slope = (securityclose[0] - securityclose[lengthMinus1]) / lengthMinus1

//min diff
m = 100000000.0
for i = 0 to lengthMinus1
m = min(m, securityclose[lengthMinus1 - i] - (securityclose[lengthMinus1] + (slope[0] * i)))
next
mindiff=m
//max diff
m = -100000000.0
for i = 0 to lengthMinus1
m = max(m, securityclose[lengthMinus1 - i] - (securityclose[lengthMinus1] + (slope[0] * i)))
next
maxdiff=m

bridgerangebottom = securityclose + mindiff

bridgerangetop = securityclose + maxdiff

ATR = AverageTrueRange[length](close)

logLength = log(length)

hurst = (log(highest[length](securityhigh) - lowest[length](securitylow)) - log(ATR)) / logLength

sd = std[length](securityclose)

WMA = WeightedAverage[length](securityclose)

bbbottom = WMA - (sd * 2)

bbtop = WMA + (sd * 2)

bridgebandbottom = bbbottom + ((bridgerangebottom - bbbottom) * abs((hurst * 2) - 1))

bridgebandtop = bbtop - ((bbtop - bridgerangetop) * abs((hurst * 2) - 1))

bridgebandmid = bridgebandbottom + ((bridgebandtop - bridgebandbottom) / 2)

trend = lowest[trendlength](securitylow) + ((highest[trendlength](securityhigh) - lowest[trendlength](securitylow)) / 2)

bullish = securityclose > trend

if bullish then
r=0
g=255
else
r=255
g=0
endif

timeframe(default)
//Band Fills
drawtriangle(barindex[1],bridgebandtop[1],barindex,bridgebandbottom,barindex[0],bridgebandtop[0]) coloured(r,g,0,25) bordercolor(r,g,0,0)
drawtriangle(barindex[1],bridgebandtop[1],barindex[1],bridgebandbottom[1],barindex[0],bridgebandbottom[0]) coloured(r,g,0,25) bordercolor(r,g,0,0)


return trend coloured(r,g,0),bridgebandbottom coloured(r,g,0) style(line,3),bridgebandtop coloured(r,g,0) style(line,3)
Download
Filename:
PRC_Bridge-Bands-1.itf
Downloads:
227
Master
I created ProRealCode because I believe in the power of shared knowledge. I spend my time coding new tools and helping members solve complex problems.
If you are stuck on a code or need a fresh perspective on a strategy, I am always willing to help. Welcome to the community!
Author’s Profile
Loading...