

BreakOut/Breakout search Indicator
December 6, 2017, 9:32 AM
Indicators
3 Comments
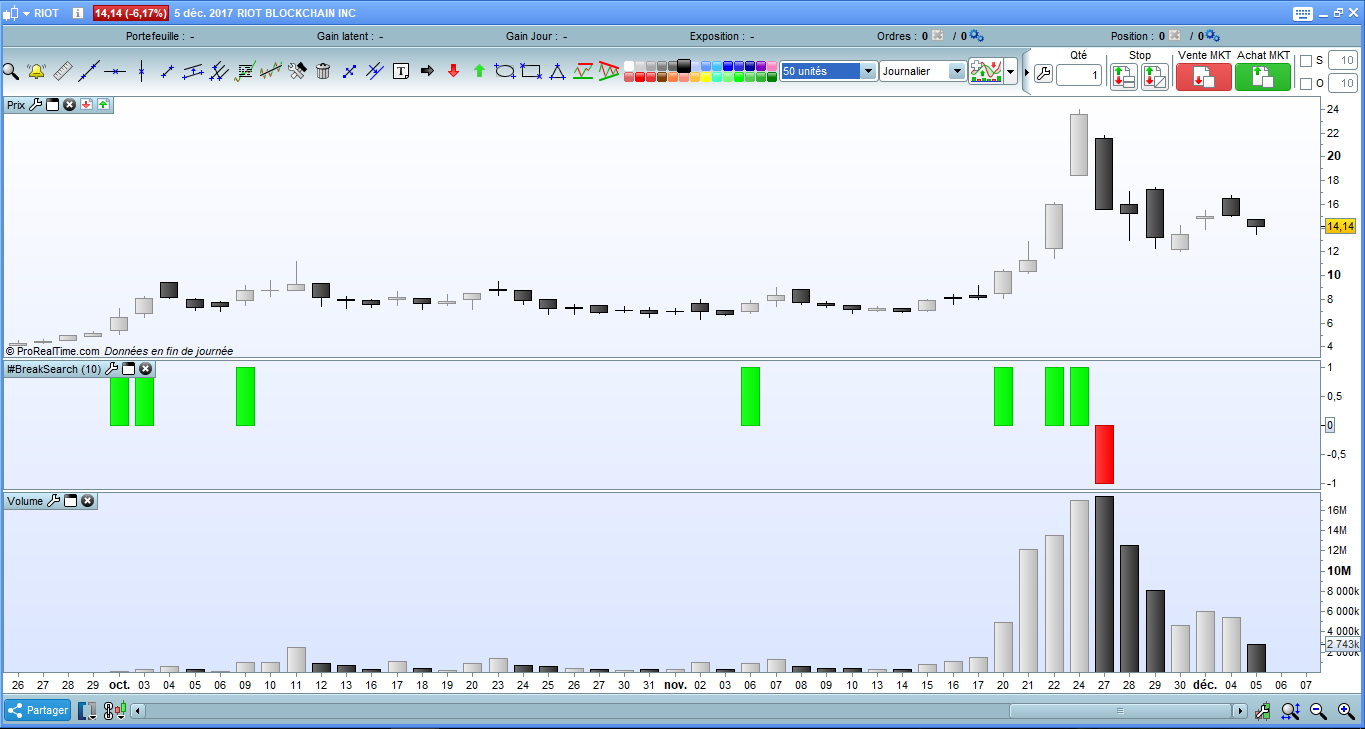
This indicator indicates on the graph, an event Breakout in green color.
In red, a BreakDown.
The basic indicator is the index force coupled with the Bollinger Band to identify a statistical anomaly on the closing price caused by volumes.
If the upper band of the bollinger bands is exceeded by the forceindex, it’s mean a BreakOut.
A BreakDown when the lower band of bollinger is exceeded.
// Name : BreakSearch indicator
// author : patmaba
// date : 2017/dec/05
//
// Purpose
// -------
// This indicator indicates on the graph, an event Breakout in green color.
// In red, a BreakDown.
//
// Parameter
// ---------
// It uses a parameter p to determine the period. by default it is set to 10.
//
// Description
// -----------
// The basic indicator is the index force coupled with the Bollinger Band to identify a statistical anomaly on the closing price caused by volumes.
// If the upper band of the bollinger bands is exceeded by the forceindex, it's mean a BreakOut. A BreakDown when the lower band of bollinger is exceeded.


fi=ForceIndex(close)
bu=BollingerUp[p](fi)
bd=BollingerDown[p](fi)

breakValue=0

// color variable
redColorValue=0
greenColorValue=0

// Check statistical anomaly(BollingerBands) on price by volume(ForceIndex)
if fi >= bu then // here the BreakOut
 breakValue=1
 greenColorValue=255
elsif fi <= bd then // here the BreakDown
 breakValue=-1
 redColorValue=255
endif

return breakValue coloured(redColorValue,greenColorValue,0) style(histogram) as "BreakOut/Down"
Download
Filename:
BreakSearch-indicator.itf
Downloads:
703
Junior
Developer by day, aspiring writer by night. Still compiling my bio... Error 404: presentation not found.
Author’s Profile
Loading...