

Break Out Analysis Tool
This break out analysis tool allows us to set a look back period (p) and then analyses breakouts of that periods highest high and lowest low in the next p bars. It can then return the results in three formats.:
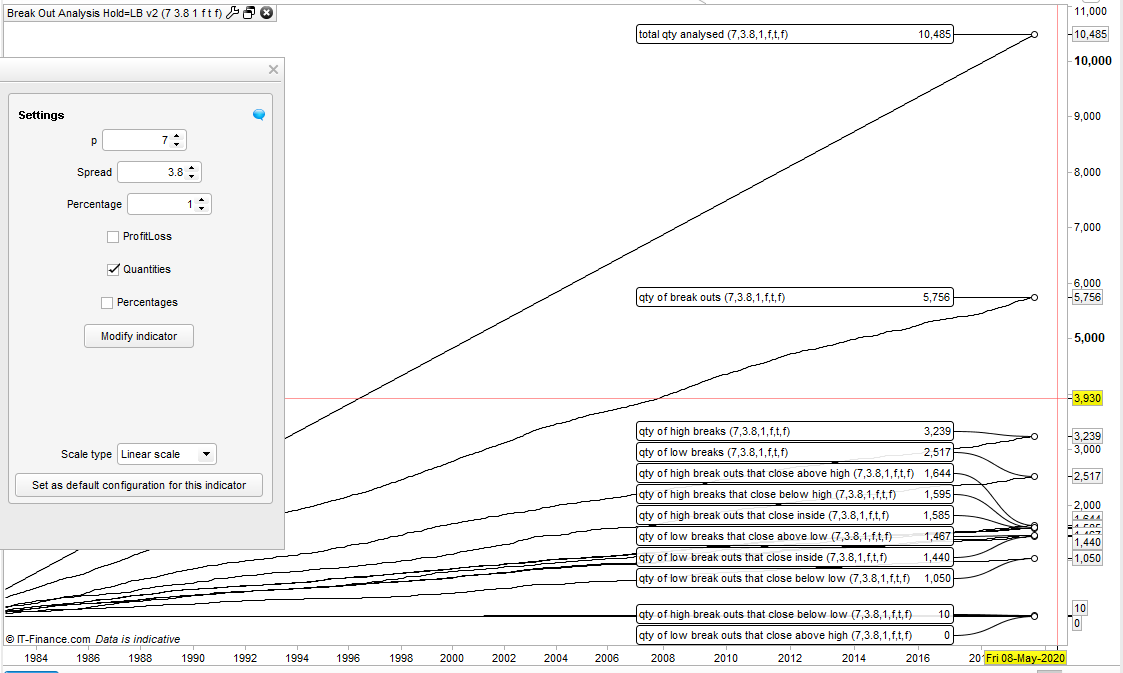
- The quantity of breakouts and their conclusion.
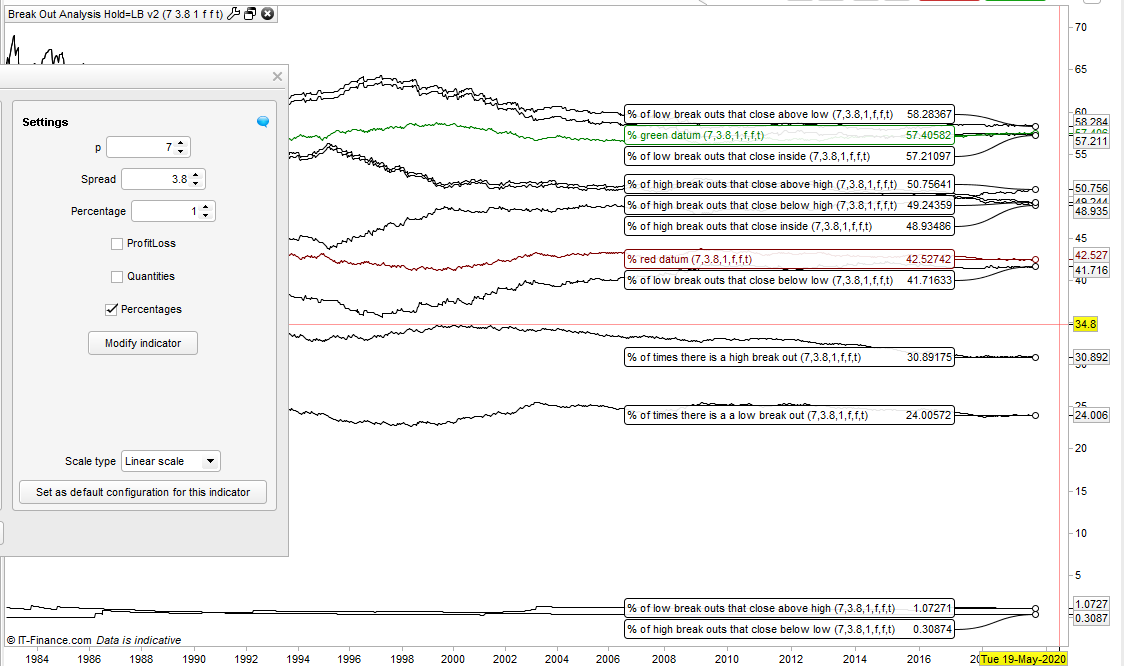
- The percentage of breakouts and then the percentage of their conclusions.
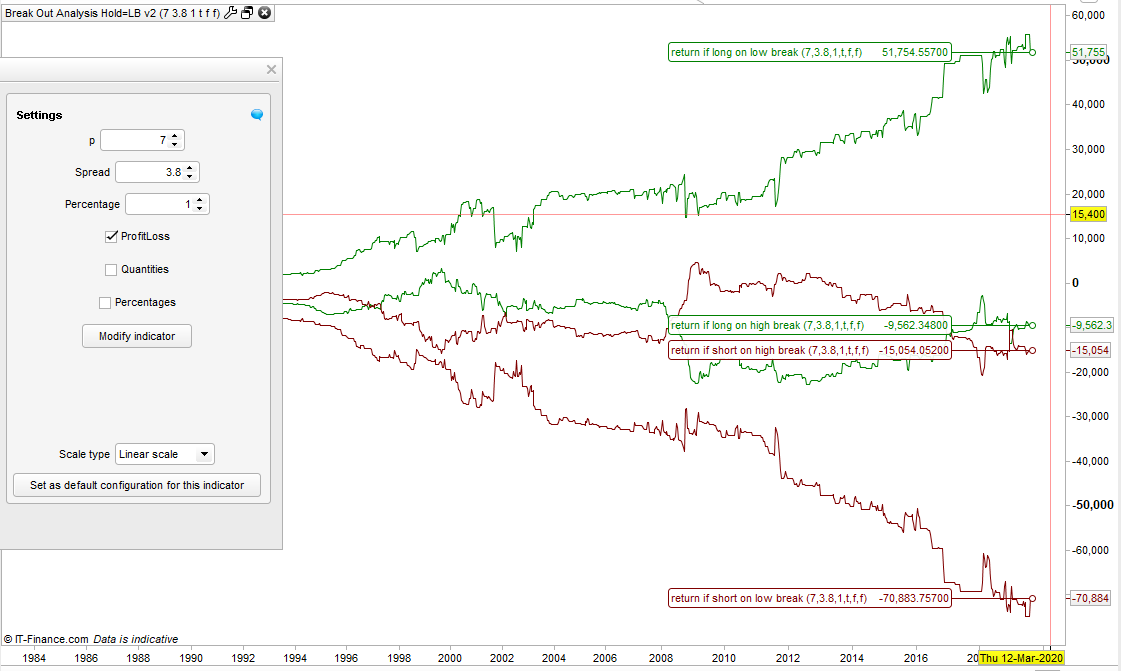
- The Profit/Loss if you had gone long or short at a break out price and then sold at the end of the p long period.
In the percentage return ‘% green datum’ and ‘% red datum’ are the percentage of ups or downs when comparing close to open of the p test period. So for example if p = 7 then how many 7 bar periods end up or end down. This is just to give us a market datum to compare to.
It is possible to add or subtract a percentage to the highest high and lowest low breakout levels by changing the ‘Percent’ variable.
It is also possible to include a fixed spread in the profit and loss calculations by changing the ‘Spread’ variable.
Turn on and off the displayed lines for percentage, profit and loss and quantities using the tick boxes to make the output easier to read.
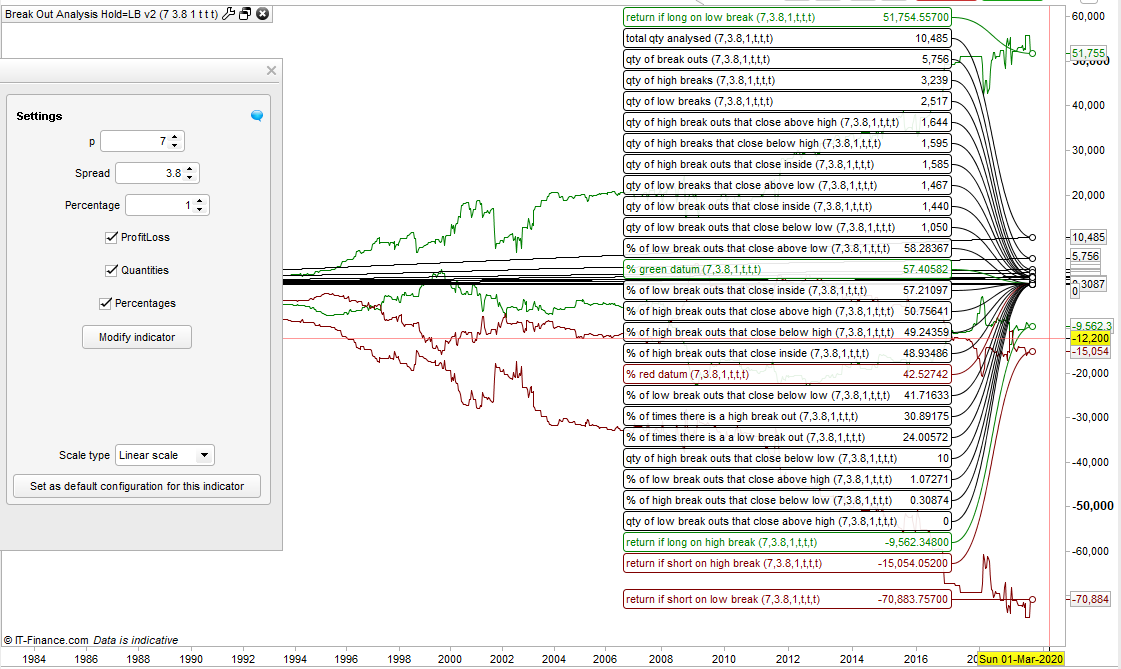
So for example in the images attached we can see that on the DJI daily if we set our p to 7 days then it checks for breakouts of the highest high and lowest low of every seven day period in the seven days following that period. It then simulates profit/loss if you closed the trade at the end of that seven day period.
10485 sets of data were analysed and there were 5756 breakouts in the test. 3239 breaks of the highest high (31% of the time) and 2517 breaks of the lowest low (24% of the time).
Our green datum is 57% and our red datum is 43% meaning that if at anytime we had just gone long then we would have been right 57% of the time at the end of the 7 days and wrong 43% of the time.
58% of the time a low break resulted in the closing price being higher than the break price at the end of the seven days.
If you had been going short at every 7 day high break price and expecting it to close below the low break price then you would have only been successful 0.03% of the time.
57% of low breaks close somewhere between the low break price and the high break price. Only 1% of the time is a low break price hit and then the close is above the high break price.
If you had been going long at the low break price of every seven day period and sold at the end of the following 7 day period then you would have a profit of £51755 with a 3.8 spread.
If you had been going short at the low break price of every seven day period and sold at the end of the following 7 day period then you would have a loss of £70884.
Obviously there is a lot more information but the above highlights some of the stand out analysis.
Hopefully this break out analysis tool can help us understand each instruments characteristics and increase our probability of trading in the most profitable direction at a break out.
I suggest downloading and importing the ITF file to get full functionality.
//Break Out Analysis Tool Hold = Lookback v2
//By Vonasi
//20190828

//p = 3
//Spread = 0
//Percentage = 0
//Profitloss = 0
//Quantities = 0
//Percentages = 0

hh = highest[p](high[p]) * (1 + (percentage/100))
ll = lowest[p](low[p]) * (1 - (percentage/100))
myopen = open[p-1]

hhao = highest[p](high)
llao = lowest[p](low)

if barindex > p * 2 then
count = count + 1

if hhao > hh then
hb = hb + 1
if close < hh and close > ll then
hbci = hbci + 1
endif
if close > hh then
hbcah = hbcah + 1
endif
if close < ll then
hbcbl = hbcbl + 1
endif
if close < hh then
hbcbh = hbcbh + 1
endif
longhb = longhb + (close - hh)-spread
shorthb = shorthb + (hh - close)-spread
endif

if llao < ll then
lb = lb + 1
if close < hh and close > ll then
lbci = lbci + 1
endif
if close < ll then
lbcbl = lbcbl + 1
endif
if close > hh then
lbcah = lbcah + 1
endif
if close > ll then
lbcal = lbcal + 1
endif
longlb = longlb + (close - ll)-spread
shortlb = shortlb + (ll - close)-spread
endif

if close > myopen then
green = green + 1
endif

if close < myopen then
red = red + 1
endif
endif

if not percentages then
greenperc = undefined
redperc = undefined
hbperc = undefined
lbperc = undefined
hbciperc = undefined
lbciperc = undefined
hbcblperc = undefined
hbcahperc = undefined
lbcblperc = undefined
lbcahperc = undefined
hbcbhperc = undefined
hbcbhperc = undefined
lbcalperc = undefined
lbcalperc = undefined
else
greenperc = (green/count)*100
redperc = (red/count)*100
hbperc = (hb/count)*100
lbperc = (lb/count)*100
hbciperc = (hbci/hb)*100
lbciperc = (lbci/lb)*100
hbcblperc = (hbcbl/hb)*100
hbcahperc = (hbcah/hb)*100
lbcblperc = (lbcbl/lb)*100
lbcahperc = (lbcah/lb)*100
hbcbhperc = (hbcbh/hb)*100
hbcbhperc = (hbcbh/hb)*100
lbcalperc = (lbcal/lb)*100
lbcalperc = (lbcal/lb)*100
endif
//endif

if not profitloss then
rlonglb = undefined
rlonghb = undefined
rshortlb = undefined
rshorthb = undefined
else
rlonglb = longlb
rlonghb = longhb
rshortlb = shortlb
rshorthb = shorthb
endif

if not quantities then
rcount = undefined
rhb = undefined
rlb = undefined
rhbci = undefined
rlbci = undefined
rhbcbl = undefined
rhbcah = undefined
rlbcah = undefined
rlbcbl = undefined
rhbcbh = undefined
rlbcal = undefined
rbtot = undefined
else
rcount = count
rhb = hb
rlb = lb
rhbci = hbci
rlbci = lbci
rhbcbl = hbcbl
rhbcah = hbcah
rlbcal = lbcah
rlbcbl = lbcbl
rhbcbh = hbcbh
rlbcal = lbcal
rbtot = hb + lb
endif

return greenperc coloured(0,128,0) as "% green datum" , redperc coloured(128,0,0) as "% red datum", hbperc as "% of times there is a high break out", lbperc as "% of times there is a a low break out", hbcahperc as "% of high break outs that close above high", lbcahperc as "% of low break outs that close above high", hbciperc as "% of high break outs that close inside", lbciperc as "% of low break outs that close inside", hbcblperc as "% of high break outs that close below low", lbcblperc as "% of low break outs that close below low", rlonghb coloured(0,128,0) as "return if long on high break", rshorthb coloured(128,0,0) as "return if short on high break", rlonglb coloured(0,128,0) as "return if long on low break", rshortlb coloured(128,0,0) as "return if short on low break", hbcbhperc as "% of high break outs that close below high", lbcalperc as "% of low break outs that close above low", rcount as "total qty analysed", rhb as "qty of high breaks", rlb as "qty of low breaks", rhbci as "qty of high break outs that close inside", rlbci as "qty of low break outs that close inside", rhbcbl as "qty of high break outs that close below low", rhbcah as "qty of high break outs that close above high", rlbcah as "qty of low break outs that close above high", rlbcbl as "qty of low break outs that close below low", rhbcbh as "qty of high breaks that close below high", rlbcal as "qty of low breaks that close above low", rbtot as "qty of break outs"