

Braid Filter
April 6, 2023, 3:32 PM
Indicators
1 Comment
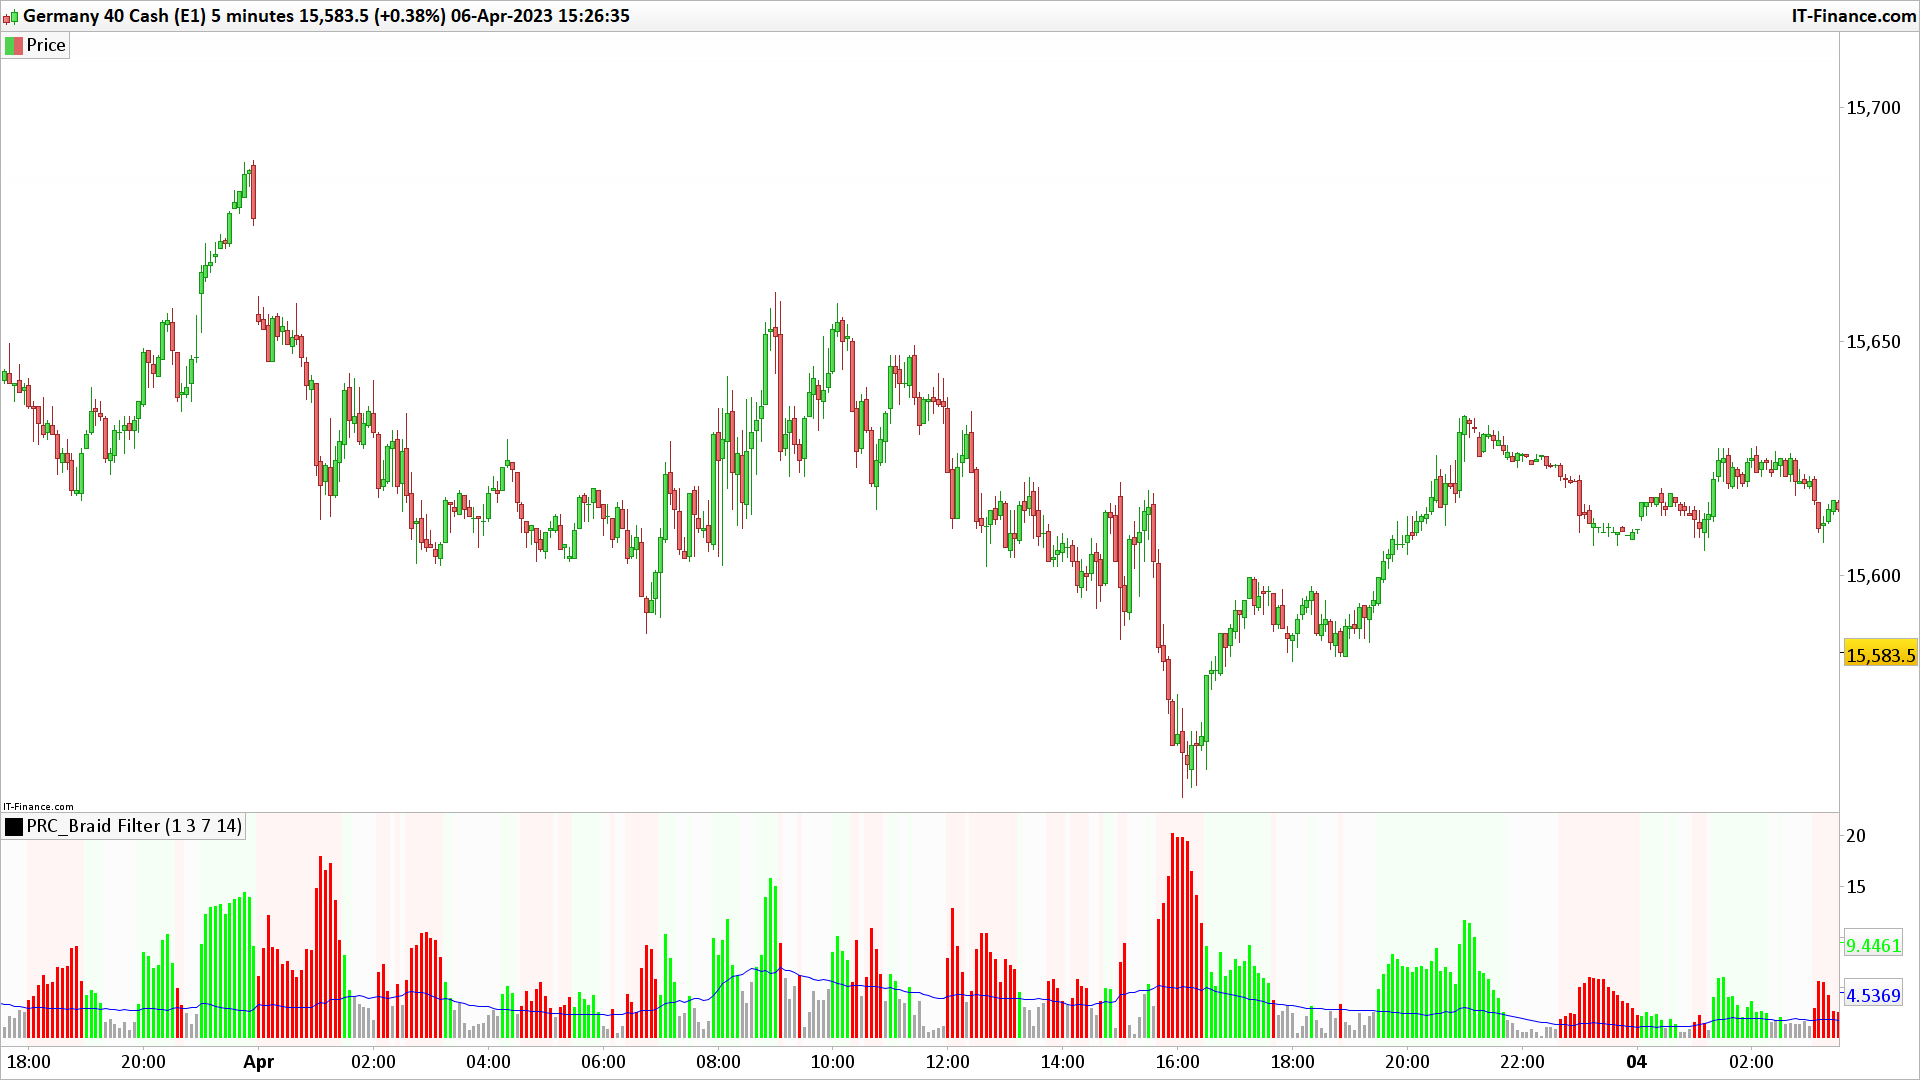
This oscillator determines the trend based on the maximum and minimum values between 3 different moving averages of chosen type. The distance between that 2 MA must be superior to 40% of the value of ATR (Average True Range) to confirm the trend by coloring the histogram into green for bullish and red for bearish. If histogram is gray, then no trend is identified.
//PRC_Braid Filter | indicator
//06.04.23
//Nicolas @ www.prorealcode.com
//Sharing ProRealTime knowledge

// --- settings
maType = 1 //0 = SMA 1 = EMA 2 = WMA 3 = Wilder 4 = Triangular 5 = End point 6 = Time series 7 = Hull 8 = ZeroLag
Period1 = 3 //Period 1
Period2 = 7 //Period 2
Period3 = 14 //Period 3
// --- end of settings

PipsMinSepPercent = 40

//-- Braid Filter
ma01 = average[period1,maType](close)
ma02 = average[period2,maType](open)
ma03 = average[period3,maType](close)

imax  = max(max(ma01, ma02), ma03)
imin  = min(min(ma01, ma02), ma03)
dif  = imax - imin

filter = AverageTrueRange[14](close) * PipsMinSepPercent / 100

//-- Plots
if ma01 > ma02 and dif > filter then
 r=0
 g=255
 b=0
elsif ma02 > ma01 and dif > filter then
 r=255
 g=0
 b=0
else
 r=168
 g=168
 b=168
endif

backgroundcolor(r,g,b,10)

return dif as "Braid" coloured(r,g,b) style(histogram), filter as "Filter" coloured("blue")
Download
Filename:
PRC_Braid-Filter.itf
Downloads:
140
Legend
I created ProRealCode because I believe in the power of shared knowledge. I spend my time coding new tools and helping members solve complex problems.
If you are stuck on a code or need a fresh perspective on a strategy, I am always willing to help. Welcome to the community!
Author’s Profile
Loading...