

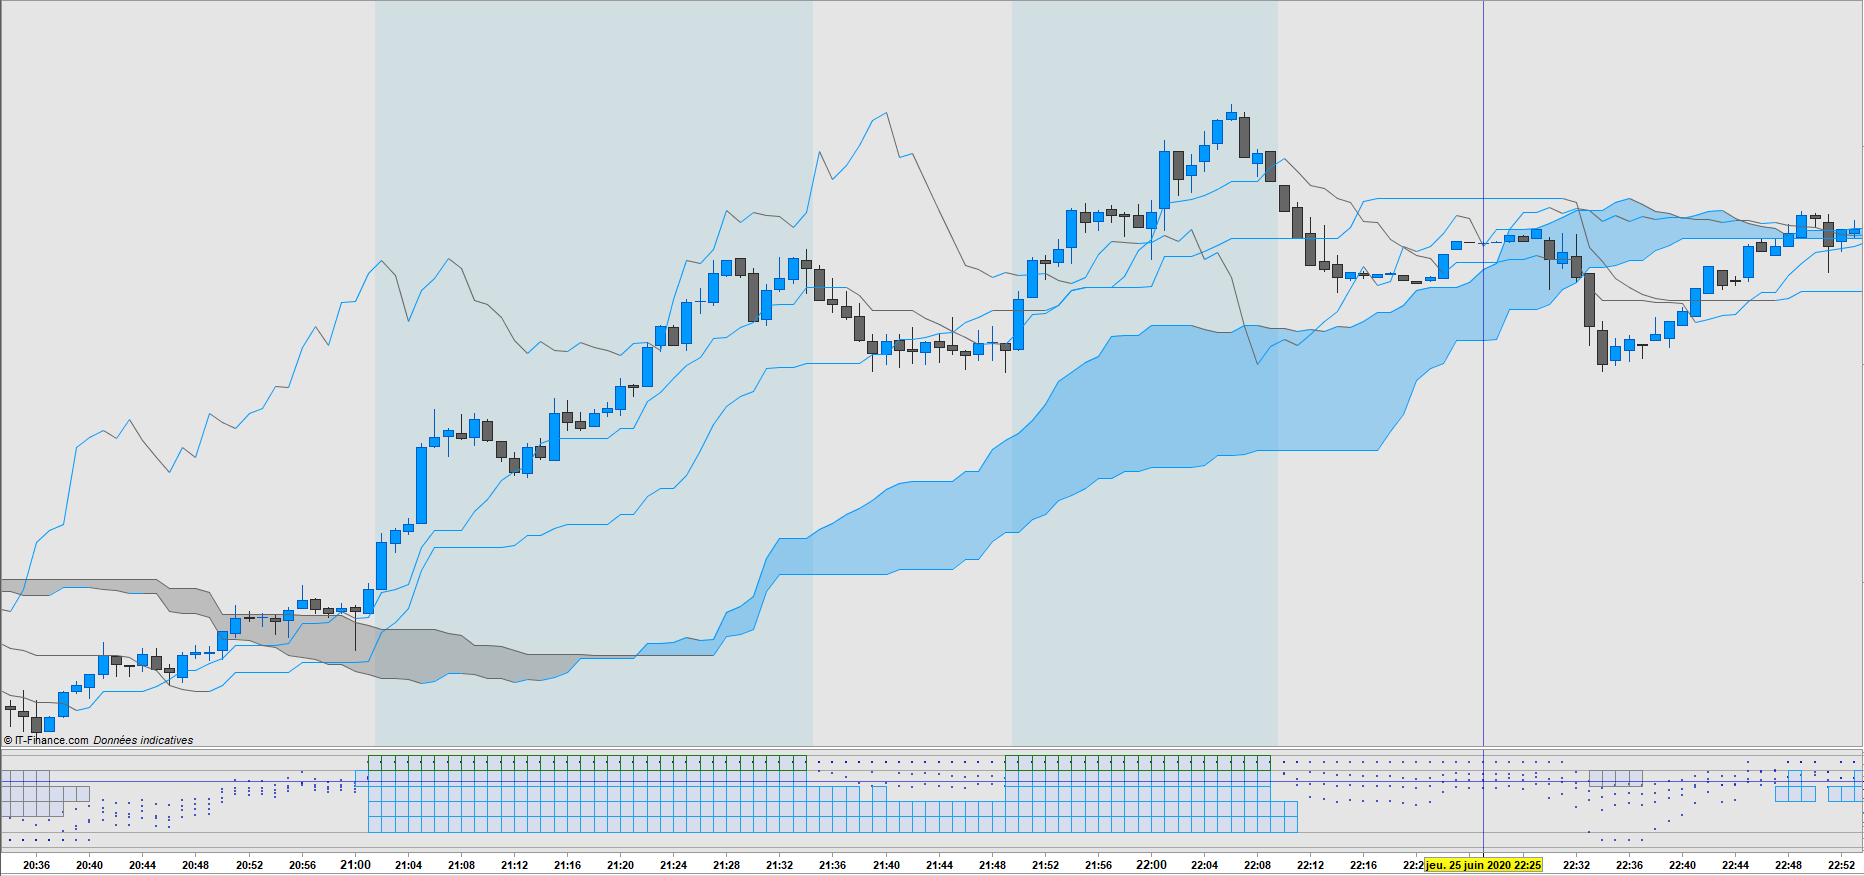
Bollinger%B Histogram phases
This indicator uses the Bollinger%B which is a buy and sell indicator.
Being correlated to the Bollinger, by decreasing the values of this indicator, you get a momentum of intensity.
I have therefore chosen to use the 50-100-150-200 values for momentum.
It will indicate the phases on which the price is most likely to explode up or down.
However, to be more relevant and to limit false signals, I recommend using it with ichimoku, not for the trend it gives us, but for these signals to enter into position
Reminds: Tenkan + Kijun break or trend oriented Tenkan break
The values of this indicator make it more useful for scalping in order to limit false signals and benefit from the best opportunities this indicator offers.
Units larger than M5 will have no use unless you change the values 50-100-150-200 and the values 75 and 25 to find the best combination.
I recommend working on your own strategy.
Sincerely yours,
//--------------------Indicateur

s = 2
t = 1
prix = customclose
//BP1
gd2X = average[50,t](prix)
sdX = s*STD[50](prix)
bollsupX = gd2X + sdX
bollinfX = gd2X - sdX
BP1 = 100*(close - bollinfX)/ ( BOLLSUPX -BOLLINFX)

//BP2
gd2XX = average[100,t](prix)
sdXX = s*STD[100](prix)
bollsupXX = gd2XX + sdXX
bollinfXX = gd2XX - sdXX
BP2 = 100*(close - bollinfXX)/ ( BOLLSUPXX -BOLLINFXX)

//BP3
gd2XXX = average[150,t](prix)
sdXXX = s*STD[150](prix)
bollsupXXX = gd2XXX + sdXXX
bollinfXXX = gd2XXX - sdXXX
BP3 = 100*(close - bollinfXXX)/ ( BOLLSUPXXX -BOLLINFXXX)

//BP4
gd2XXXX = average[200,t](prix)
sdXXXX = s*STD[200](prix)
bollsupXXXX = gd2XXXX + sdXXXX
bollinfXXXX = gd2XXXX - sdXXXX
BP4 = 100*(close - bollinfXXXX)/ ( BOLLSUPXXXX -BOLLINFXXXX)

//--------------------Commandes Des Signaux Haussier

//Signal Trend UP
if BP1 > 75 and BP2 > 75 and BP3 > 75 and BP4 > 75 then
signal5 = 1
else
signal5 = 0
endif
if signal5 = 1 then
backgroundcolor(62,169,203,30)
endif

//--------------------Commandes Des Signaux Baissier

//Signal Trend Down
if BP1 < 25 and BP2 < 25 and BP3 < 25 and BP4 < 25 then
signal10 = 1
else
signal10 = 0
endif
if signal10 = 1 then
backgroundcolor(73,73,73,30)
endif

return
//--------------------Paramettre de Base

//Paramettre de Cadrage
if close > open then
signalC = 1
else
signalC = 0
endif
if signalC = 1 then
drawcandle(75,75,75,75)coloured(0,0,0,0)
endif
if signalC = 0 then
drawcandle(25,25,25,25)coloured(0,0,0,0)
endif

//Indicateur

s = 2
t = 1
prix = customclose

gd2X = average[50,t](prix)
sdX = s*STD[50](prix)
bollsupX = gd2X + sdX
bollinfX = gd2X - sdX
BP1 = 100*(close - bollinfX)/ ( BOLLSUPX -BOLLINFX)

gd2XX = average[100,t](prix)
sdXX = s*STD[100](prix)
bollsupXX = gd2XX + sdXX
bollinfXX = gd2XX - sdXX
BP2 = 100*(close - bollinfXX)/ ( BOLLSUPXX -BOLLINFXX)

gd2XXX = average[150,t](prix)
sdXXX = s*STD[150](prix)
bollsupXXX = gd2XXX + sdXXX
bollinfXXX = gd2XXX - sdXXX
BP3 = 100*(close - bollinfXXX)/ ( BOLLSUPXXX -BOLLINFXXX)

gd2XXXX = average[200,t](prix)
sdXXXX = s*STD[200](prix)
bollsupXXXX = gd2XXXX + sdXXXX
bollinfXXXX = gd2XXXX - sdXXXX
BP4 = 100*(close - bollinfXXXX)/ ( BOLLSUPXXXX -BOLLINFXXXX)

//--------------------Visuel BP

//BP1
if BP1 > 75 then
BP1 = 81.25
elsif BP1 < 25 then
BP1 = 18.75
endif

//BP2
if BP2 > 75 then
BP2 = 81.25
elsif BP2 < 25 then
BP2 = 18.75
endif

//BP3
if BP3 > 75 then
BP3 = 81.25
elsif BP3 < 25 then
BP3 = 18.75
endif

//BP4
if BP4 > 75 then
BP4 = 81.25
elsif BP4 < 25 then
BP4 = 18.75
endif

//--------------------Commandes Des Signaux Haussier

//BP1
if BP1 > 75 then
signal1 = 1
else
Signal1 = 0
endif
if signal1 = 1 then
drawrectangle(barindex[1],75,barindex,62.5)coloured(32,162,236)
endif

//BP2
if BP2 > 75 then
signal2 = 1
else
Signal2 = 0
endif
if signal2 = 1 then
drawrectangle(barindex[1],62.5,barindex,50)coloured(32,162,236)
endif

//BP3
if BP3 > 75 then
signal3 = 1
else
Signal3 = 0
endif
if signal3 = 1 then
drawrectangle(barindex[1],50,barindex,37.5)coloured(32,162,236)
endif

//Signal UP 200
if BP3 > 75 then
signal4 = 1
else
Signal4 = 0
endif
if signal4 = 1 then
drawrectangle(barindex[1],37.5,barindex,25)coloured(32,162,236)
endif

//Signal Trend
if BP1 > 75 and BP2 > 75 and BP3 > 75 and BP4 > 75 then
signal5 = 1
else
signal5 = 0
endif
if signal5 = 1 then
drawrectangle(barindex[1],75,barindex,87.5)coloured(27,124,22)
endif

//--------------------Commandes Des Signaux Baissier

//BP1
if BP1 < 25 then
signal6 = 1
else
Signal6 = 0
endif
if signal6 = 1 then
drawrectangle(barindex[1],75,barindex,62.5)coloured(132,132,132)
endif

//BP2
if BP2 < 25 then
signal7 = 1
else
Signal7 = 0
endif
if signal7 = 1 then
drawrectangle(barindex[1],62.5,barindex,50)coloured(132,132,132)
endif

//BP3
if BP3 < 25 then
signal8 = 1
else
Signal8 = 0
endif
if signal8 = 1 then
drawrectangle(barindex[1],50,barindex,37.5)coloured(132,132,132)
endif

//BP4
if BP4 < 25 then
signal9 = 1
else
Signal9 = 0
endif
if signal9 = 1 then
drawrectangle(barindex[1],37.5,barindex,25)coloured(132,132,132)
endif

//Signal Trend
if BP1 < 25 and BP2 < 25 and BP3 < 25 and BP4 < 25 then
signal10 = 1
else
signal10 = 0
endif
if signal10 = 1 then
drawrectangle(barindex[1],25,barindex,12.5)coloured(191,42,42)
endif

return 25coloured(73,73,73,100) as "25",12.5coloured(73,73,73,100) as "12.5",75coloured(73,73,73,100) as "75",87.5coloured(73,73,73,100) as "87.5",BP1 coloured(4,24,191,180) style (point,2) as "BP1",BP2 coloured(4,24,191,180) style(point,2) as "BP2",BP3 coloured(4,24,191,180) style(point,2) as "BP3",BP4 coloured(4,24,191,180) style(point,2) as "BP4"