

Bear and Bull volume indicator
February 5, 2018, 7:59 AM
Indicators
57 Comments
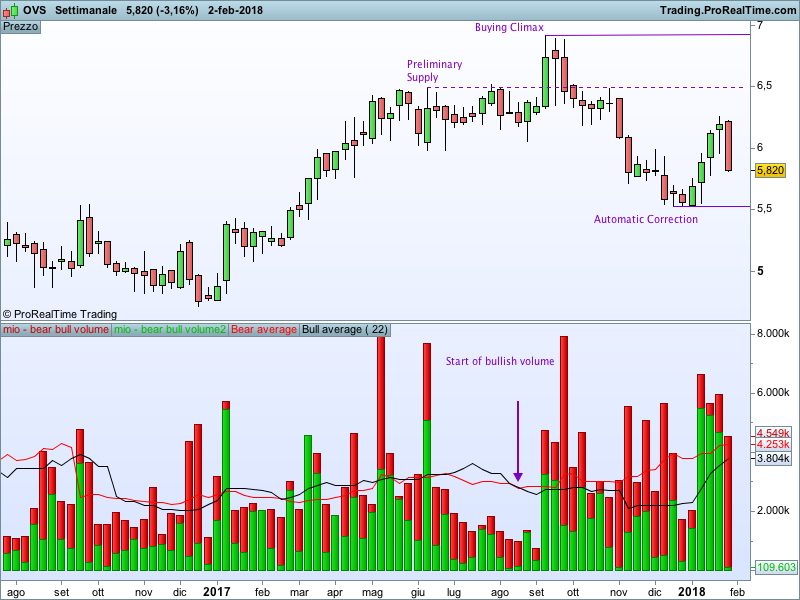
This code is mainly for Wyckoffians and can be used in accumulation/distribution phases to spot the change of forces.
The volume bars are showing who is stronger in the period defined in the timeframe (more green means that bulls are running the show, in this case, in the weekly period).
The moving averages are showing the same information but based on an historical point of view (when the bull line crosses over the bear line bulls are becoming stronger in the longer period).
I suggest to use a period of 22 or more and always based on the timeframe in use.
Blue skies!!
ref=(close-low)/range
volbull=ref*volume
volbear=volume

if close>=open then
 greenbarcount=1
 greenvolume=volume
 redbarcount=0
 redvolume=0
else
 greenbarcount=0
 greenvolume=0
 redbarcount=1
 redvolume=volume
endif
//media volumi rossi e verdi per media mobile semplice
mmred=summation[period](redvolume)/summation[period](redbarcount)
mmgreen=summation[period](greenvolume)/summation[period](greenbarcount)

return volbear coloured (205,0,0) style (histogram), volbull coloured (0,190,0) style (histogram), mmred coloured (255,0,0) as "Bear average",mmgreen as "Bull average"
Download
Filename:
bear-bull-volume.itf
Downloads:
1087
Master
I usually let my code do the talking, which explains why my bio is as empty as a newly created file. Bio to be initialized...
Author’s Profile
Loading...