

BB MACD (Bollinger Bands on MACD)
October 16, 2017, 11:12 AM
Indicators
10 Comments
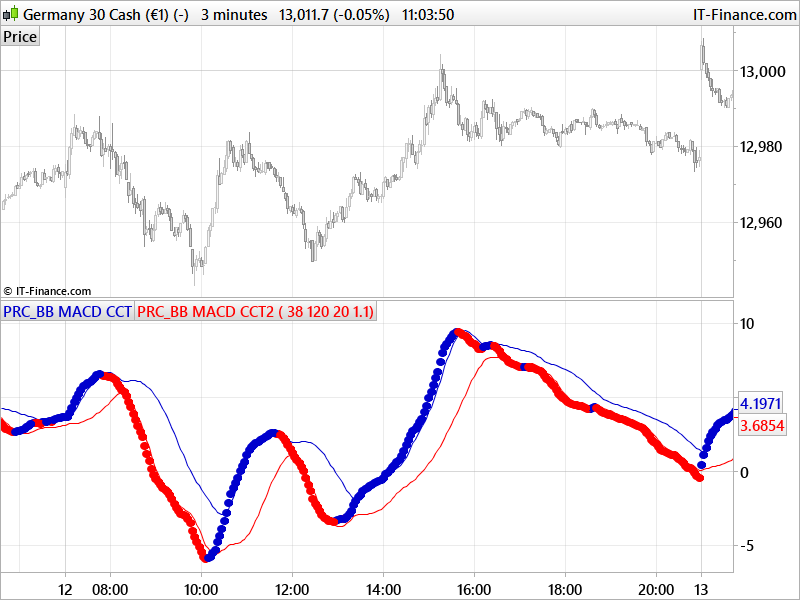
Bollinger Bands on MACD, with different settings you’ll find many ways to use it (mean reverting or with breakout the upper and lower bands).
The MACD line is plotted with blue and red dots as per the original indicator (this one is a conversion from a MT4 one requested by one of our member).
//PRC_BB MACD CCT | indicator
//16.10.2017
//Nicolas @ www.prorealcode.com
//Sharing ProRealTime knowledge
//converted from MT4 version

// --- settings
//FastLen = 38
//SlowLen = 120
//Length = 20
//StDv = 1.1
// --- end of settings

bbMacd = average[FastLen,1]-average[SlowLen,1]

avg = average[Length,1](bbMacd)
sDev = std[Length](bbMacd)

UpperBand = avg+(StDv*sDev)
LowerBand = avg-(StDv*sDev)

if bbMacd>bbMacd[1] then
 r=0
 b=205
else
 r=255
 b=0
endif

drawtext("●",barindex,bbMacd,Dialog,Bold,10) coloured(r,0,b)

return UpperBand coloured(0,0,205) style(line), LowerBand coloured(255,0,0) style (line)
Download
Filename:
PRC_BB-MACD-CCT.itf
Downloads:
962
Legend
I created ProRealCode because I believe in the power of shared knowledge. I spend my time coding new tools and helping members solve complex problems.
If you are stuck on a code or need a fresh perspective on a strategy, I am always willing to help. Welcome to the community!
Author’s Profile
Loading...