







Bar Count Reversals (Pivot Points High/Low)
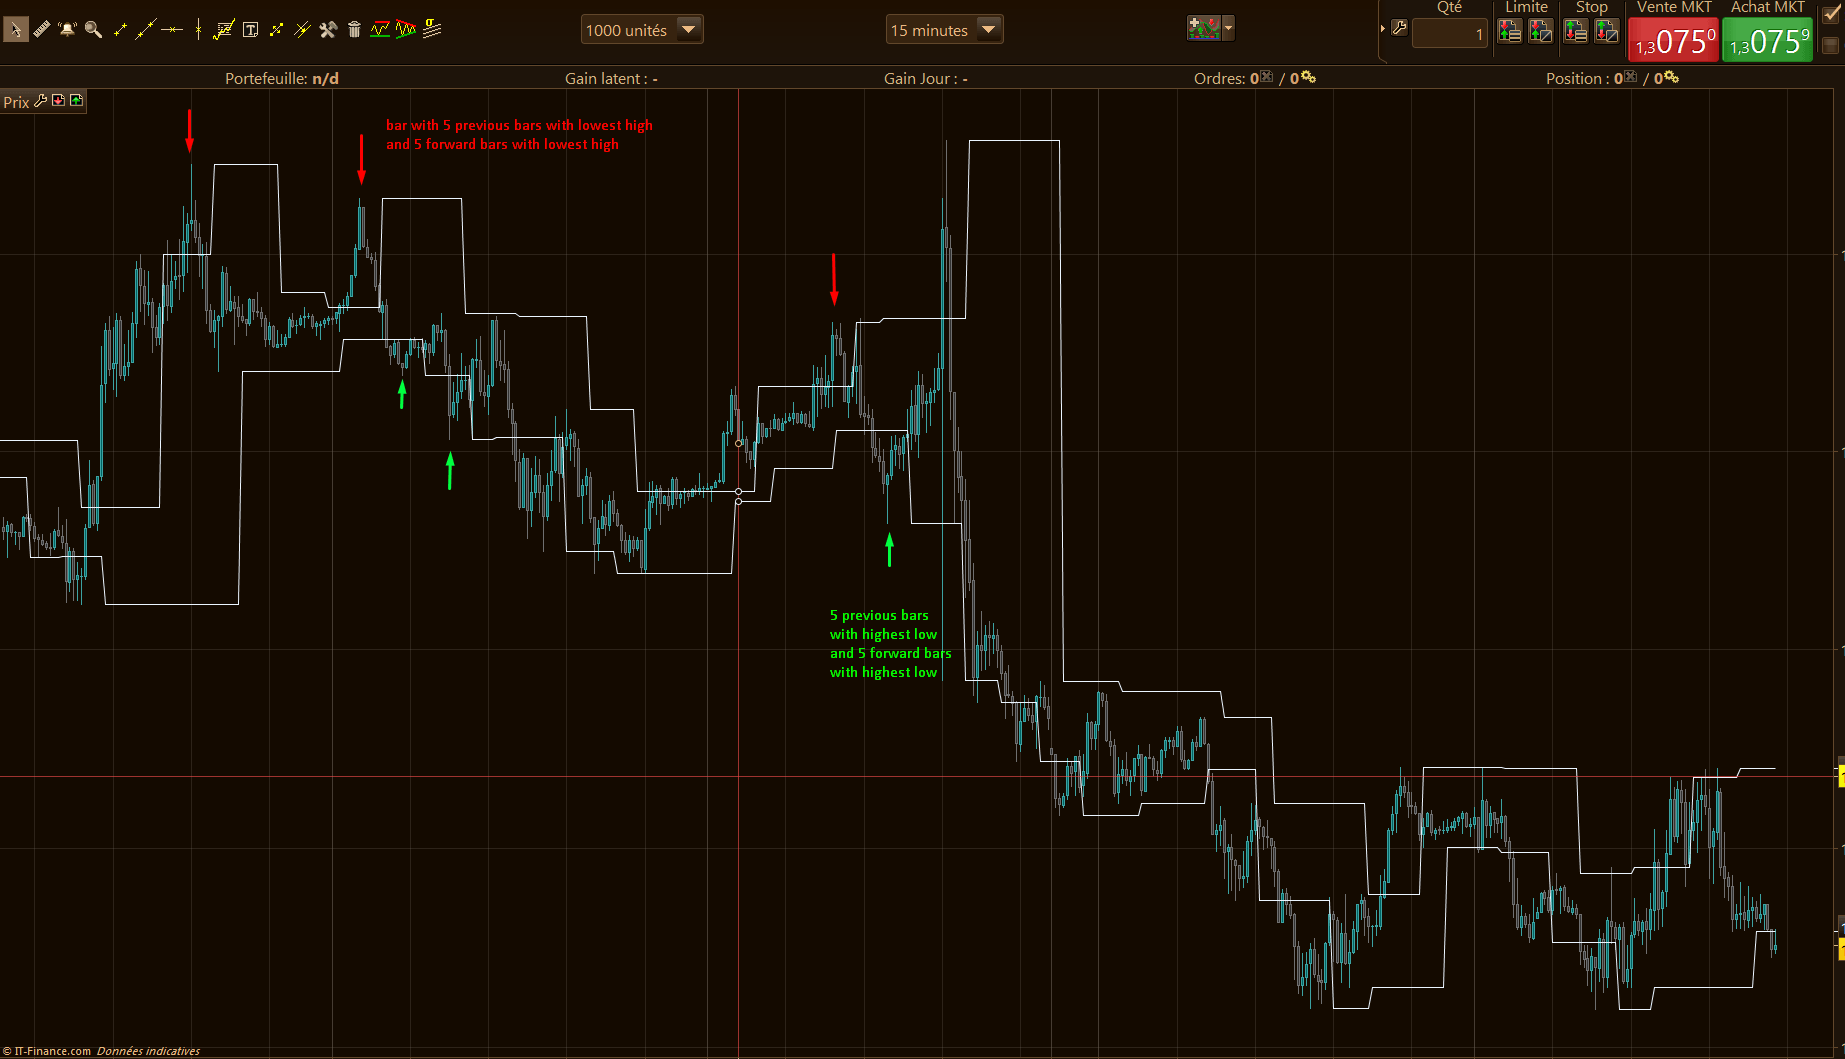
Pivot Points (High/Low), also known as Bar Count Reversals, are used to anticipate potential price reversals. Pivot Point Highs are determined by the number of bars with lower highs on either side of a Pivot Point High. Pivot Point Lows are determined by the number of bars with higher lows on either side of a Pivot Point Low.
For example, a Pivot Point High, with a period of 5, requires a minimum of 11 bars to be considered a valid Pivot Point. A minimum of 5 bars before and after the Pivot Point High all have to have lower highs.
The default period is set to 10 (p=10). It means that the whole calculation are made within 11 bars (10 bars with a pivot bar on the middle of them).
(coded by request on English forum)
//PRC_PivotHiLo
//30.08.2016
//Nicolas @ www.prorealcode.com
//Sharing ProRealTime knowledge

p = 10

period = round(p/2)+1
hh = high[period]
ll = low[period]
countH = 0
countL = 0
for i = 1 to period-1 do
 if high[i]<hh then
  countH=countH+1
 endif
 if low[i]>ll then
  countL=countL+1
 endif
next
for i = period+1 to p+1 do
 if high[i]<hh then
  countH=countH+1
 endif
 if low[i]>ll then
  countL=countL+1
 endif
next

if countH=p then
 pivotH = high[period]
endif
if countL=p then
 pivotL = low[period]
endif

RETURN pivotH, pivotL
Comments
You must be logged in to post a comment.

Hi Nicolas, another really helpful bit of code, thank you! Can I ask how you might amend so that the lines on the chart are not connected, ie you just see the horizontal levels and not the vertical change ups. Conscious that you can switch the indicator view to points but I was looking for lines if possible. Thanks vm

NUEVAMENTE REPITO, ESTE ES EL MEJOR INDICADOR PARA HACER SISTEMAS DE COMPRA Y VENTA. NO ES BUENO , ! ES EXCELENTE¡, UNA VEZ ENCUENTREN LA FORMA DE UTILIZARLO LOS SISTEMAS QUE HAGAN NO BAJAN DE TENER UN PORCENTAJE DE ACIERTO DE 90 % MINIMO.
GRACIAS NICOLAS
Muy buen indicador, lo estoy utilizando en un probacktest y es un excelente filtro para entradas.



Good evening Nicolas, could you tell me where thae arrows on the chart come from ? I don't see them when I install the indicator on my charts. Many thanks for advance