
The code takes the pivot line and adds the average daily ranges of the previous days to create support and resistance bands. Lines are plotted with ATR*1 and ATR*2.
How to use and read:
- Price tends not to break ATR*2 level
- Price tends to retrace on ATR*1 levels
- Balance Point = Pivot Line
- Is more reliable to me than pivot levels
- I use it for intraday target and stop levels and sometimes for entries
CODE:
|
1 2 3 4 5 6 7 8 9 10 11 12 |
BP = (Dhigh(1)+Dlow(1)+Dclose(1))/3 n = 20 Move = AverageTrueRange[n](BP) far = 2 A = BP-Move A2 = BP-(Move*far) B = BP+Move B2 = BP+(Move*far) RETURN A As "N-", A2 As "2N-", B As "N+", B2 As "2N+", BP As "BalancePoint" |
Share this
No information on this site is investment advice or a solicitation to buy or sell any financial instrument. Past performance is not indicative of future results. Trading may expose you to risk of loss greater than your deposits and is only suitable for experienced investors who have sufficient financial means to bear such risk.
ProRealTime ITF files and other attachments :
Find other exclusive trading pro-tools on ![]()
PRC is also on YouTube, subscribe to our channel for exclusive content and tutorials


Nice idea and accurate, thanks for sharing!
Nice Job
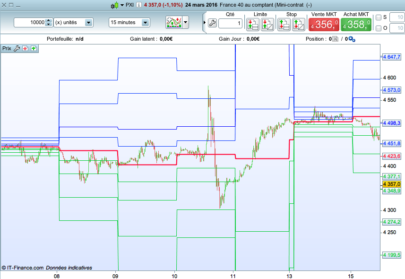
Be careful,
It works only if you are in daily timeframe, and on your graphic you are on hour timeframe 😉
(BP is on daily timeframe and your average on hour timeframe)
If you want to have this S/R on hour timeframe you should multiply by a coef
Have a nice day
Zilliq
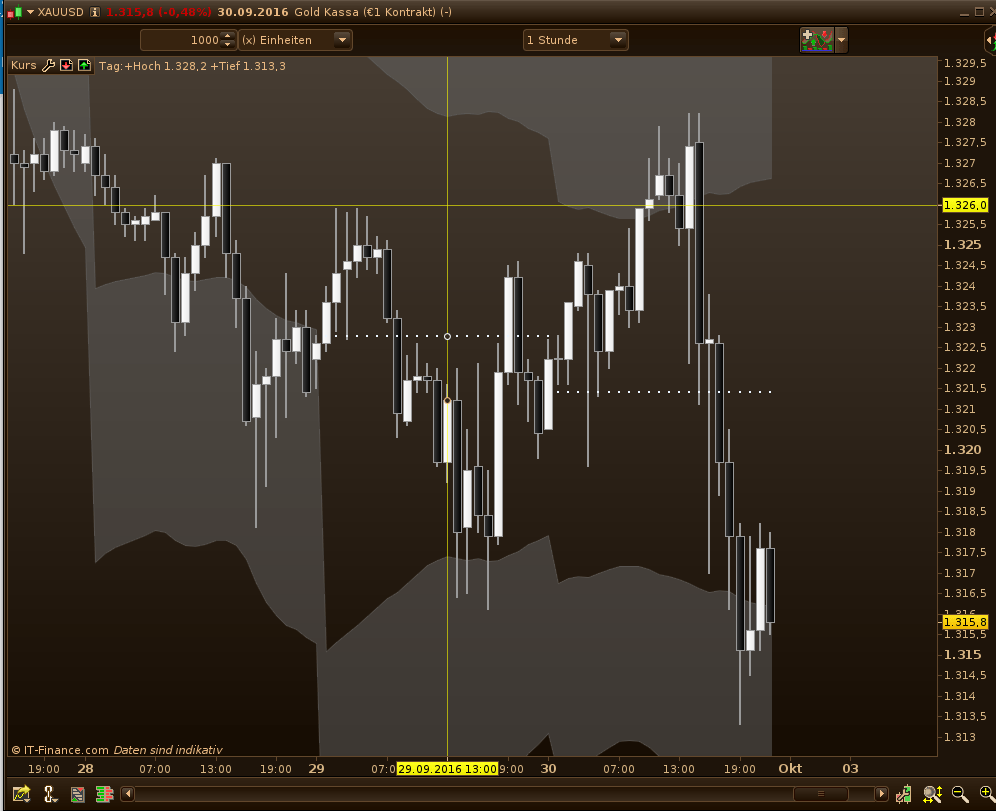
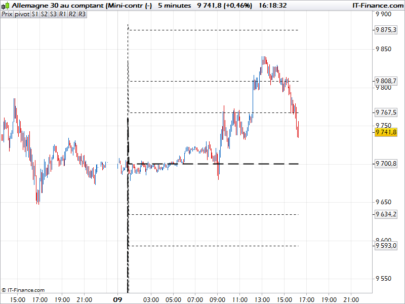
I guess you are right, like always. If you change n to 24 you have at least the hours of a day, even if it is moving and the BP not. The reason it regularly fits to the current market is it’s adaptability. If you plot Pivot lines, to which the market usually reacts intraday, they are always somewhere inbetween ATR and ATR*2 and they are regularly invalidated. ATR*2 is only in strong trends invalidated. Just yesterday Gold went to ATR*2 retraced there and waited for a new day and lower resistance levels to take out my stop.
Something I did not mention of what you can read, as I am still not sure about. If market starts above BP, you have to consider top ATR*2 and bottom ATR as major resistance and support. If it starts below BP, you can consider ATR*2 bottom and ATR top as major support and resistance. Can someone verify or invalidate this theory?
DerPat,
you can also change line1 to read as follow to adapt this script to hourly timeframes (and lower)
BP = (high[1]+low[1]+close[1])/3
or just use
bp=typicalprice[1]