

Average True Range Support and Resistance Bands
October 3, 2016, 7:36 AM
Indicators
5 Comments
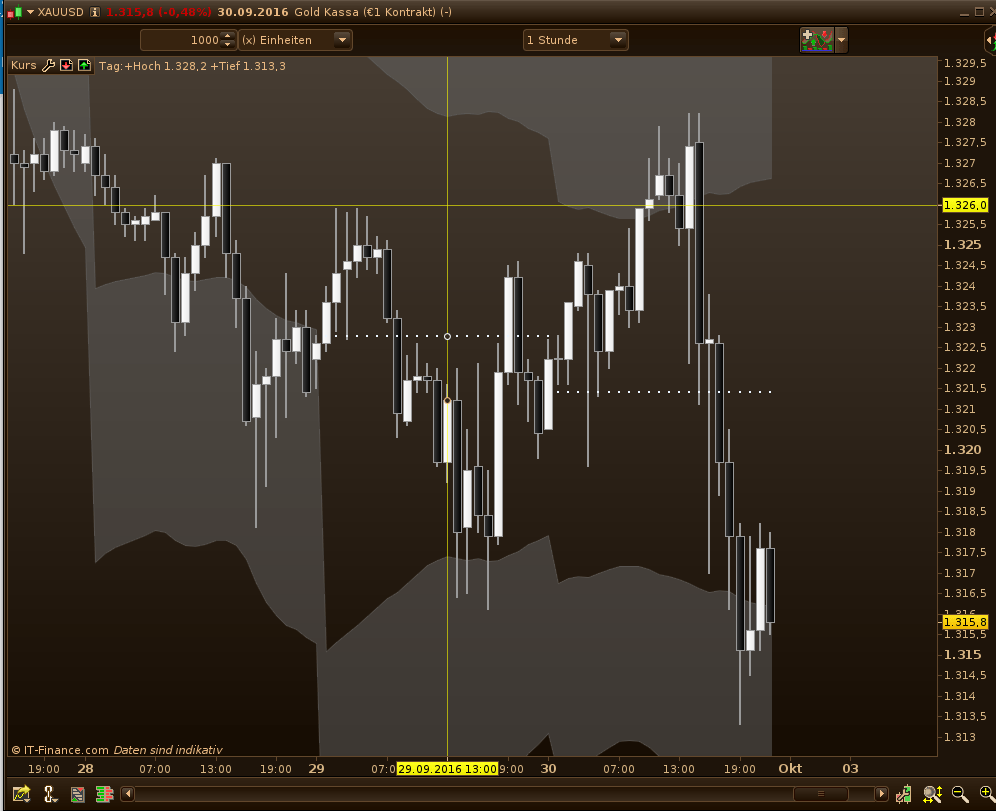
The code takes the pivot line and adds the average daily ranges of the previous days to create support and resistance bands. Lines are plotted with ATR*1 and ATR*2.
How to use and read:
- Price tends not to break ATR*2 level
- Price tends to retrace on ATR*1 levels
- Balance Point = Pivot Line
- Is more reliable to me than pivot levels
- I use it for intraday target and stop levels and sometimes for entries
CODE:
BP = (Dhigh(1)+Dlow(1)+Dclose(1))/3

n = 20
Move = AverageTrueRange[n](BP)
far = 2

A = BP-Move
A2 = BP-(Move*far)
B = BP+Move
B2 = BP+(Move*far)

RETURN A As "N-", A2 As "2N-", B As "N+", B2 As "2N+", BP As "BalancePoint"
Download
Filename:
PFL_True_Range_SR_week.itf
Downloads:
164
Download
Filename:
PFL_True_Range_SR.itf
Downloads:
348
Junior
I usually let my code do the talking, which explains why my bio is as empty as a newly created file. Bio to be initialized...
Author’s Profile
Loading...