

Average Sentiment Oscillator
Description of this indicator from its author:
Average Sentiment Oscillator
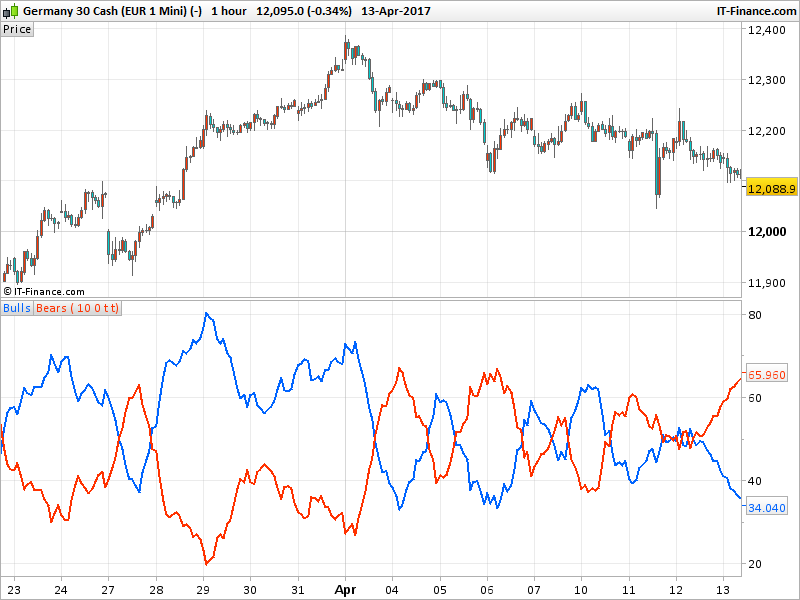
Momentum oscillator of averaged bull/bear percentages.
We suggest using it as a relatively accurate way to gauge the sentiment of a given period of candles, as a trend filter or for entry/exit signals.
It’s a combination of two algorithms, both essentially the same but applied in a different way. The first one analyzes the bullish/bearishness of each bar using OHLC prices then averages all percentages in the period group of bars (eg. 10) to give the final % value. The second one treats the period group of bars as one bar and then determines the sentiment percentage with the OHLC points of the group. The first one is noisy but more accurate in respect to intra-bar sentiment, whereas the second gives a smoother result and adds more weight to the range of price movement. They can be used separately as Mode 1 and Mode 2 in the indicator settings, or combined as Mode 0.
Original indicator idea from Benjamin Joshua Nash, converted from MT4 version by a request in the english forum.
//PRC_AverageSentimentOscillator | indicator
//16.04.2017
//Nicolas @ www.prorealcode.com
//Sharing ProRealTime knowledge
//https://www.prorealcode.com/topic/average-sentiment-oscillator/

//---Settings
//AsoPeriod=10
//Mode=0
//ShowBulls=1 //(boolean)
//ShowBears=1 //(boolean)
//---end of settings

intrahigh=High
intralow =Low
intraopen=Open
intrarange = intrahigh-intralow
grouplow = Lowest[AsoPeriod](low)
grouphigh = Highest[AsoPeriod](high)
groupopen = Open[AsoPeriod-1]
grouprange = grouphigh-grouplow
if (intrarange=0) then
 intrarange=1
endif
if (grouprange=0) then
 grouprange=1
endif

intrabarbulls = ((((close-intralow)+(intrahigh-intraopen))/2)*100)/intrarange
groupbulls = ((((close-grouplow)+(grouphigh-groupopen))/2)*100)/grouprange
intrabarbears = ((((intrahigh-close)+(intraopen-intralow))/2)*100)/intrarange
groupbears = ((((grouphigh-close)+(groupopen-grouplow))/2)*100)/grouprange

if (Mode=0) then
 TempBufferBulls=(intrabarbulls+groupbulls)/2
 TempBufferBears=(intrabarbears+groupbears)/2
elsif (Mode=1) then
 TempBufferBulls=intrabarbulls
 TempBufferBears=intrabarbears
elsif (Mode=2) then
 TempBufferBulls=groupbulls
 TempBufferBears=groupbears
endif

if ShowBulls then
 AsoBufferBulls=average[AsoPeriod](TempBufferBulls)
endif
if ShowBears then
 AsoBufferBears=average[AsoPeriod](TempBufferBears)
endif

RETURN AsoBufferBulls coloured(0,100,255) style(line,2) as "Bulls",  AsoBufferBears coloured(255,50,0) style(line,2) as "Bears"