

Average Penetration Indicator
Thank you to Markos Katsanos and his article in the June 2018 edition of Technical Analysis of Stocks and Commodities magazine for this idea.
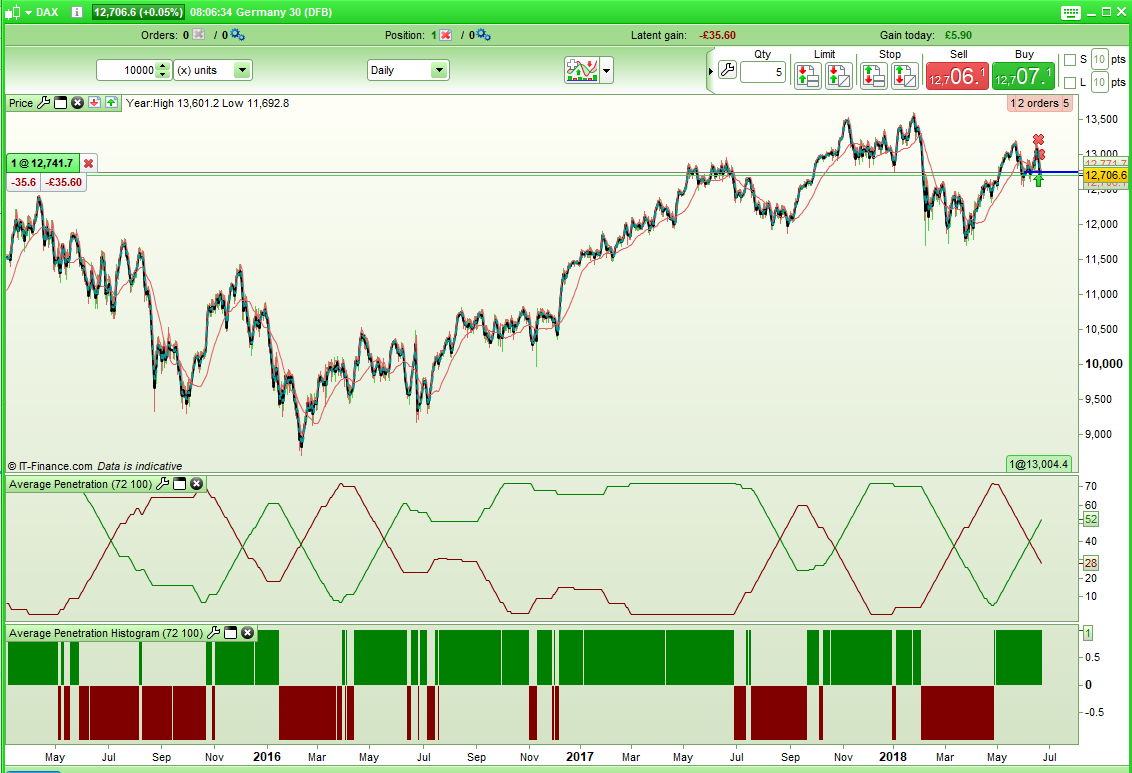
This indicator counts the number of times that a candles high or low penetrates a simple moving average line. The period of average and look back period can be adjusted to suit the market being traded.
The author was using an average of 100 and a look back period of 3 months. He was also only counting the number of times that the close penetrates the average line but I decided that high and low penetration gave more interesting results. On the line chart the red line is number of times the low is below the average line during the look back period and the green line is the number of times the high is above the average line. So green above red = bullish market and red above green = bearish market.
It can also be seen that when the red and green are converging that a bull run or bear run may be coming to an end. I converted the indicator into a histogram to more easily show this. The histogram switches to bullish or bearish if the lines start converging but otherwise is bullish if green is above red and bearish if the opposite.
The author calls his version his ‘Stiffness’ filter. I will let your own imagination work out why!
Both codes are included here along with ITF files to import. I recommend importing over cut and paste to get full functionality.
//Average Penetration Indicator
//Coded by Vonasi
//21 June 2018

//LBPeriod = 63
//AvePeriod = 100

LowPen = summation[LBPeriod](low < Average[AvePeriod])
HighPen = summation[LBPeriod](high > Average[AvePeriod])

return LowPen coloured(128,0,0), HighPen coloured(0,128,0)
//Average Penetration Histogram
//Coded by Vonasi
//21 June 2018
//LBPeriod = 63
//AvePeriod = 100
LowPen = summation[LBPeriod](low < Average[AvePeriod])
HighPen = summation[LBPeriod](high > Average[AvePeriod])
IF HighPen > LowPen then
Flag = 1
endif
IF HighPen < LowPen then
Flag = -1
endif
If flag = 1 and Highpen - LowPen < HighPen[1] - LowPen[1] then
Flag = -1
endif
IF flag = -1 and LowPen - HighPen < LowPen[1] - HighPen[1] then
Flag = 1
endif
If flag > 0 then
R = 0
G = 128
else
R = 128
G = 0
endif
return Flag coloured(R,G,0) style(Histogram,2) as "Average Penetration"