

Automatic drawing Standard Deviation Channel
February 22, 2019, 1:29 PM
Indicators
5 Comments
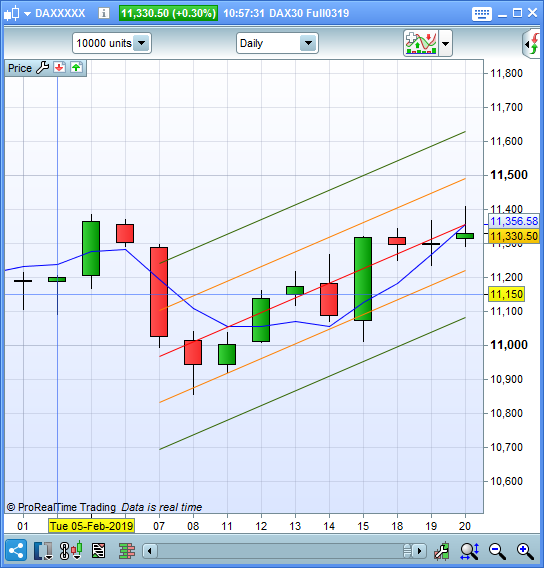
This indicator plots automatically a linear regression channel with 1 and 2 standard deviation lines of the last X periods.
//Stand Dev Channel - indicator purpose : to automatically adjust every new tradingday (new candle)
DefParam DrawOnLastBarOnly = true

LinRegres = LinearRegression[LinRegPeriod](close)
LinRegresSlope = LinearRegressionSlope[LinRegPeriod](close)
StDev = STD[LinRegPeriod](close)

y1 = LinRegres - ((LinRegPeriod-1)*LinRegresSlope)

//RegressionLine
DRAWSEGMENT(barindex-(LinRegPeriod-1),y1,barindex,LinRegres)coloured(255,0,0)
//Stdev+1
DRAWSEGMENT(barindex-(LinRegPeriod-1),y1+StDev,barindex,LinRegres+StDev)coloured(255,128,0)
//Stdev-1
DRAWSEGMENT(barindex-(LinRegPeriod-1),y1-StDev,barindex,LinRegres-StDev)coloured(255,128,0)
//Stdev+2
DRAWSEGMENT(barindex-(LinRegPeriod-1),y1+(2*StDev),barindex,LinRegres+(2*StDev))coloured(51,102,0)
//Stdev-2
DRAWSEGMENT(barindex-(LinRegPeriod-1),y1-(2*StDev),barindex,LinRegres-(2*StDev))coloured(51,102,0)

Return
Download
Filename:
StandDevChannelprobuilder.itf
Downloads:
302
Average
Developer by day, aspiring writer by night. Still compiling my bio... Error 404: presentation not found.
Author’s Profile
Loading...