

Autocorrelation Price Forecasting
1. Introduction
The Autocorrelation Price Forecasting indicator is designed to detect cyclical patterns in financial asset prices and generate a prediction of their likely future movement. It is based on the statistical analysis of price autocorrelation, a fundamental concept in time series theory.
Autocorrelation measures the degree of similarity between a price series and a lagged version of itself over time. When prices show strong autocorrelation, they may be following a repetitive or cyclical pattern that can be leveraged to anticipate future movements. This indicator aims to identify such cycles and, when detected, estimates the future price using a projection based on linear regression applied to recent returns.
The goal is to provide a visual and analytical tool that helps traders spot moments when the market is behaving in a repetitive manner—particularly useful for assets that tend to move in cycles or ranges.
2. How the Indicator Works
The Autocorrelation Price Forecasting indicator operates through several key stages, each serving a distinct analytical function:
a) Manual Pearson correlation calculation
At the core of the indicator is the manual computation of the Pearson correlation coefficient between the current price and a lagged version of it, defined by the length parameter. This is done over a specified analysis window (window). The result is a value between -1 and 1 that indicates the strength of the relationship between both price series.
b) Cycle detection
If the autocorrelation value exceeds a specific threshold, the indicator considers that a meaningful cycle is present in the market, making a prediction viable.
c) Linear regression on returns
When a cycle is detected, the indicator calculates percentage returns and applies linear regression to assess the slope of the return series. This slope reflects the expected direction and strength of the movement.
d) Future price forecasting
Using the calculated slope, the indicator estimates a future price by applying the projected return to the current price. This estimation is drawn on the chart as a line that changes color based on the expected direction (green for bullish, red for bearish).
e) Hypothetical gain/loss
The indicator also computes the hypothetical profit or loss that would result from following the forecast, displaying it in points based on the difference between the current and projected price.
3. Indicator Interpretation
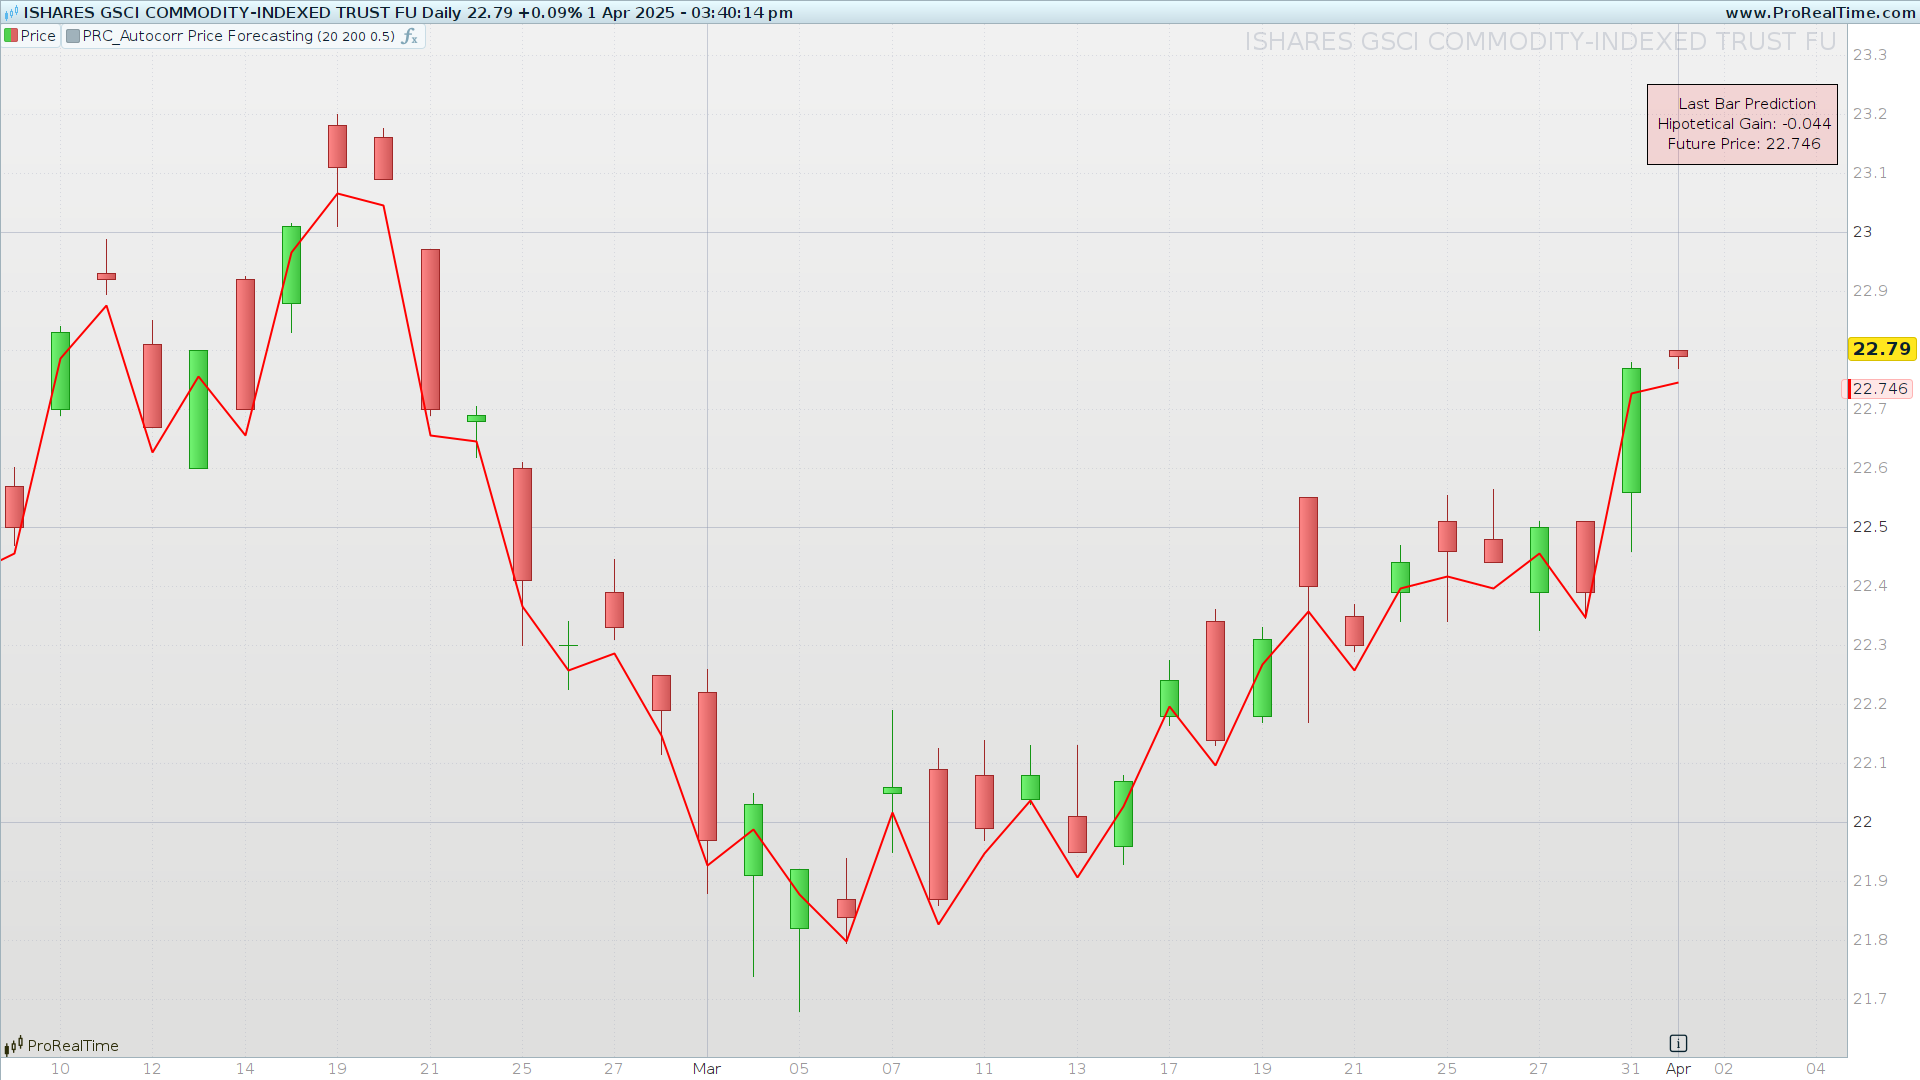
The Autocorrelation Price Forecasting displays a dynamic forecast line on the chart that updates with each new bar. This line provides a clear visual of where the price is expected to go based on detected cycles.
a) Directional signal
-
If the line is above the current price, it suggests a bullish outlook.
-
If the line is below, it suggests a bearish scenario.
b) Line coloring
-
Bright green: Indicates a forecasted upward move.
-
Bright red: Indicates a forecasted downward move.
These visual cues offer immediate insight into the projected trend.
c) On-screen forecast info
When a new bar forms, the indicator shows:
-
Hypothetical gain/loss in points.
-
Future price estimate, rounded to three decimal places.
This information is displayed in a box in the top-right corner of the chart, offering quick access without interfering with price action.
d) Use cases
This indicator can be especially effective in range-bound markets or instruments with seasonal behavior, where cyclical repetition is more common.
4. Indicator Settings
The Autocorrelation Price Forecasting offers three adjustable parameters to tailor it to different assets, timeframes, and trading styles:
a) length (default: 20)
Determines the lag period used in the autocorrelation calculation.
-
Low values: detect short-term cycles.
-
High values: focus on broader, longer-term cycles.
b) window (default: 200)
Specifies the number of bars used for correlation analysis.
-
Short window: more responsive but less stable.
-
Long window: smoother, suited for medium/long-term forecasting.
c) threshold (default: 0.5)
Defines the minimum autocorrelation level required to confirm a cycle.
-
Low threshold: more signals, but potentially noisier.
-
High threshold: fewer, but stronger signals.
Recommendation
Adjust these values based on:
-
Timeframe: longer timeframes may benefit from larger
lengthandwindow. -
Asset type: cyclic assets (commodities, indices) are ideal.
-
Trading style: lower
thresholdfor active traders, higher for confirmation-based approaches.
5. Conclusions and Practical Tips
The Autocorrelation Price Forecasting indicator offers an advanced statistical tool to anticipate price movements based on cyclical behavior.
Strengths
-
Statistical rigor: manual Pearson correlation ensures precision.
-
Cycle detection: ideal for seasonal or range-trading environments.
-
Visual clarity: colored prediction line and on-screen info enhance usability.
-
Flexible use: applicable to scalping, swing, or long-term strategies.
Limitations
-
Threshold dependency: incorrect threshold may lead to over- or under-filtering.
-
Not a complete system: best used in conjunction with other tools.
-
Contextual interpretation required: less effective during breakouts or strong trends.
Tips
-
Combine it with support/resistance levels or candlestick patterns.
-
Test multiple
lengthandwindowvalues per asset and timeframe. -
Avoid relying solely on it during trending markets—validate with other methods.
6. ProRealTime Code
//-------------------------------------------//
//PRC_Autocorr Price Forecasting
//version = 0
//01.04.2025
//Iván González @ www.prorealcode.com
//Sharing ProRealTime knowledge
//-------------------------------------------//
// Inputs
//-------------------------------------------//
length = 20         // Lag period used for autocorrelation
window = 200        // Number of bars used in the correlation window
threshold = 0.5     // Threshold value to detect the presence of a cycle
src = close         // Source data for returns calculation

//-------------------------------------------//
// Manual Pearson Correlation Calculation
//-------------------------------------------//

// Initialize sum variables for correlation formula
sumX = 0
sumY = 0
sumXY = 0
sumX2 = 0
sumY2 = 0

// Loop through the window and compute necessary sums
FOR i = 0 TO window - 1 DO
   x = close[i]               // Current value
   y = close[i + length]      // Lagged value

   sumX  = sumX  + x          // ∑x
   sumY  = sumY  + y          // ∑y
   sumXY = sumXY + x * y      // ∑xy
   sumX2 = sumX2 + x * x      // ∑x²
   sumY2 = sumY2 + y * y      // ∑y²
NEXT

// Apply the Pearson correlation formula
numerador   = window * sumXY - (sumX * sumY)
denominador = SQRT((window * sumX2 - sumX * sumX) * (window * sumY2 - sumY * sumY))

// Handle division by zero
IF denominador <> 0 THEN
   autocorr = numerador / denominador
ELSE
   autocorr = 0
ENDIF

//-------------------------------------------//
// Cycle Detection & Linear Regression
//-------------------------------------------//
cycleDetected = autocorr > threshold   // Detect if autocorrelation is strong enough

// Compute percentage returns
returns = (src - src[1]) / src[1] * 100

// Apply linear regression on returns
linreg = LinearRegression[length](returns)

// Store regression value only if a cycle is detected
IF cycleDetected THEN
   storeCyclevalue = linreg
ENDIF

//-------------------------------------------//
// Future Price Forecast
//-------------------------------------------//
futurePriceEstimate = close * (1 + storeCyclevalue / 100)     // Forecast future price
hipoteticalGain = futurePriceEstimate - close                 // Calculate expected gain/loss

//-------------------------------------------//
// Color Assignment Based on Forecast Direction
//-------------------------------------------//
IF futurePriceEstimate > close THEN
   r = 105
   g = 247
   b = 62     // Green color for bullish forecast
ELSE
   r = 255
   g = 0
   b = 0      // Red color for bearish forecast
ENDIF

//-------------------------------------------//
// Display Forecast Info on Last Bar Only
//-------------------------------------------//
IF islastbarupdate THEN
   prediction = ROUND(hipoteticalGain, 3)         // Rounded gain value
   futurePrice = ROUND(futurePriceEstimate, 3)    // Rounded estimated price

   // Draw background box (positioned top right)
   drawrectangle(-10, -60, -200, -140) ANCHOR(topright, xshift, yshift)

   // Text labels showing the forecasted values
   drawtext("Last Bar Prediction", -100, -80) ANCHOR(topright, xshift, yshift)
   drawtext("Hipotetical Gain: #prediction#", -100, -100) ANCHOR(topright, xshift, yshift)
   drawtext("Future Price: #futurePrice#", -100, -120) ANCHOR(topright, xshift, yshift)
ENDIF

//-------------------------------------------//
// Output Forecast Line on Chart
//-------------------------------------------//
RETURN futurePriceEstimate COLOURED(r, g, b) STYLE(line, 2)