

ATR Worm
This indicator was designed with the help of and , whom all my thanks go to!
I am for most part a scalper (using specific strategies, which I cannot develop here).
This indicator allows me to define the moment to open a trade.
As well as a safe distance to the next peaks / troughs (that distance not being respected, the considered trade won’t be taken).
With 2 scenarios :
- Pattern validation with the next candlestick (e.g. a pinbar after a trend correction + validation by continuation of the movement with the next candlestick) ;
- Horizontal breakout.
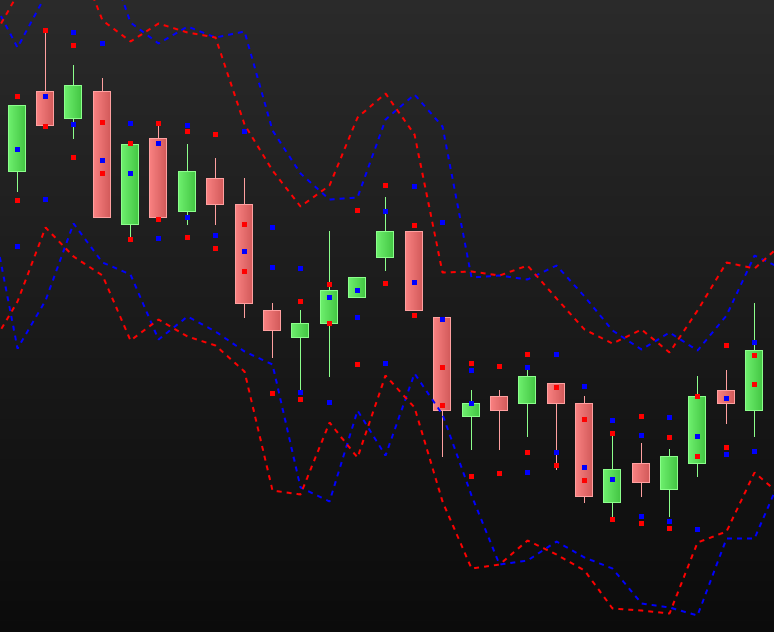
In the case of the first scenario, I take the trade on the blue spot ;
In the case of the second one, I take the trade on the red spot ;
(Two dots for each, depending on the direction of the trade) ;
The blue and red lines define the necessary distance between the opening of the trade and the next peaks / troughs (minimum ratio risk / reward of 1:1 – based on a distance from the lowest / highest of the candlestick of 0.5 pips + an ATR of 14).
Pips=0.5

monATR=AverageTrueRange[14](close)
monATR2=(AverageTrueRange[14](close)) * 2

up1 = Low[1]-Pips*pipsize+monatr
up2 = Low-Pips*pipsize+monatr
up3 = Low[1]-Pips*pipsize+monatr2
up4 = Low-Pips*pipsize+monatr2

dn1 = High[1]+Pips*pipsize-monatr
dn2 = High+Pips*pipsize-monatr
dn3 = High[1]+Pips*pipsize-monatr2
dn4 = High+Pips*pipsize-monatr2

RETURN up1 COLOURED("blue") STYLE (point,3) AS "DOT UP V",up2 COLOURED("red") STYLE (point,3) AS "DOT UP BO",up3 COLOURED("blue") STYLE (dottedline3,1) AS "BE UP V",up4 COLOURED("red")STYLE (dottedline3,1) AS "BE UP BO",dn1 COLOURED("blue") STYLE (point,3) AS "DOT DOWN V",dn2 COLOURED("red") STYLE (point,3) AS "DOT DOWN BO",dn3 COLOURED("blue")STYLE (dottedline3,1) AS "BE DOWN V",dn4 COLOURED("red")STYLE (dottedline3,1) AS "BE DOWN BO"