







ASCTrend
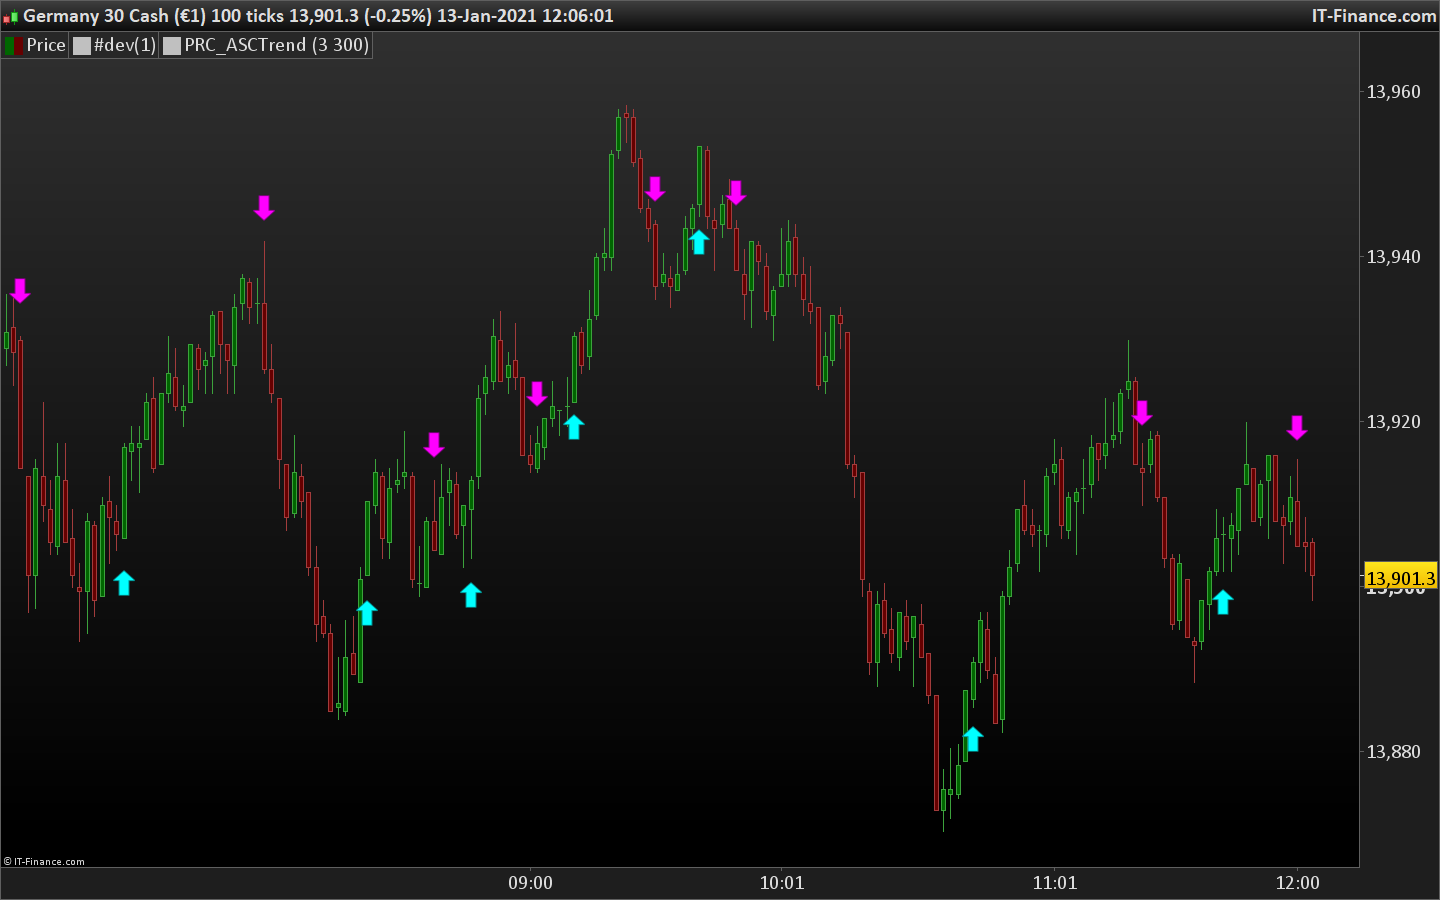
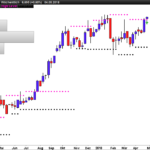
ASCTrend indicator uses WPR (Williams Percent Ratio) indicator in order to give trading signals on the price chart.
The “RISK” variable setting is used to define the WPR period this way: period = 3+RISK*2
Buy and sell levels are settled using the RSI variable also:
_ buy level > – (33 – RISK)
_ sell level < – (67 + RISK)
The trading signals are filtered to avoid the same signal repetition and price peaks or gaps.
You can modify the “CountBars” setting in order to plot more or historical signals on the price chart.
Compatible version with PRT v10.3 (or any v11 prior version) is attached to the post.
Indicator converted following a request in the trading indicators forum: https://www.prorealcode.com/topic/conversion-indicateur-mt4-asct-rend_sound-mq4/
//PRC_ASCTrend | indicator
//13.01.2021
//Nicolas @ www.prorealcode.com
//Sharing ProRealTime knowledge
//converted from MT4 version

// --- settings
RISK=3
CountBars=300
// --- end of settings

value10=3+RISK*2
x1=67+RISK
x2=33-RISK
value11=value10

shift=CountBars-11-1

if islastbarupdate and barindex>CountBars then
while(shift>=0) do

Counter=shift
iRange=0.0
AvgRange=0.0
for Counter=shift to shift+9 do
AvgRange=AvgRange+Abs(High[Counter]-Low[Counter])
next

iRange=AvgRange/10
Counter=shift
TrueCount=0
while (Counter<shift+9 and TrueCount<1) do
if (Abs(Open[Counter]-Close[Counter+1])>=iRange*2.0) then
TrueCount=TrueCount+1
endif
Counter=Counter+1
wend
if (TrueCount>=1) then
MRO1=Counter
else
MRO1=-1
endif

Counter=shift
TrueCount=0
while (Counter<shift+6 and TrueCount<1) do
if (Abs(Close[Counter+3]-Close[Counter])>=iRange*4.6) then
TrueCount=TrueCount+1
endif
Counter=Counter+1
wend
if (TrueCount>=1) then
MRO2=Counter
else
MRO2=-1
endif


if (MRO1>-1) then
value11=3
else
value11=value10
endif
if (MRO2>-1) then
value11=4
else
value11=value10
endif

value2=100-Abs(Williams[value11](close)[shift]) // PercentR(value11=9)
$Tablevalue2[shift]=value2
$val1[shift]=0
$val2[shift]=0
value3=0

if (value2<x2) then
i1=1
while ($Tablevalue2[shift+i1]>=x2 and $Tablevalue2[shift+i1]<=x1) do
i1=i1+1
wend
if ($Tablevalue2[shift+i1]>x1) then
value3=High[shift]+iRange*0.5
if (shift = 1 and flagval1=0) then
flagval1=1
flagval2=0
endif
$val1[shift]=value3
drawarrowdown(barindex[shift],$val1[shift]) coloured(255,0,255)
endif
endif

if (value2>x1) then
i1=1
while ($Tablevalue2[shift+i1]>=x2 and $Tablevalue2[shift+i1]<=x1) do
i1=i1+1
wend
if ($Tablevalue2[shift+i1]<x2) then
value3=Low[shift]-iRange*0.5
if (shift = 1 and flagval2=0) then
flagval2=1
flagval1=0
endif
$val2[shift]=value3
drawarrowup(barindex[shift],$val2[shift]) coloured(0,255,255)
endif
endif


shift=shift-1
wend
endif
return
Comments
You must be logged in to post a comment.


I tried loading it but it gives me an error on line 71 is there a fix, tried both downloads and same result.

i tried to download this and set up but it didnt seem to work on my chart.

Bizarre, j'ai importé l'indicateur et je n'ai aucun signal. PRT 11.1

Bonjour, Merci pour votre indicateur, il est très performant ! Si je ne me trompe pas : la détection de GAP (ligne 30 à 42) positionne la variable MRO1, qui en ligne 59 positionne la variable valeur11 pour le calcul du Williams, mais le test de mro2 en ligne 64 écrase alors la variable valeur11 (la valeur 3 pour le GAP est perdue) Merci pour votre travail

Bonsoir Nicolas, Je souhaiterai pouvoir être alerté, par mail, lorsque l'indicateur "achat" (flèche bleu) s'applique sur un titre et ce sur une plage horaire définie (ex : de 21hà 22h) L'idéal serait que ces alertes puissent concerner l'ensemble des titres d'une liste et non les titres dont le graphique est ouvert. Pensez vous que cela puisse être possible svp ? Au plaisir de vous lire, Nicolas :)


Bonjour Nicolas, en dépit de mes efforts, je ne parviens pas à trouver comment ajouter une condition à l'apparition des flèches par rapport à un autre indicateur, dans ce code particulier. Par exemple : afficher les flèches qui montent uniquement si le close est supérieur à une moyenne mobile et inversement. Merci beaucoup pour votre aide.





Bonjour Nicolas, Merci beaucoup pour ce super algo, il est très efficace! J'essaie de le convertir en script de trading automatique, du coup j'ai décommenté vos lignes: RISK=3 CountBars=300 j'ai remplacé la ligne 88 : drawarrowdown(barindex[shift],$val1[shift]) coloured(255,0,255) par SELLSHORT N SHARE AT MARKET et la ligne 104: drawarrowup(barindex[shift],$val2[shift]) coloured(0,255,255) par BUY N SHARE AT MARKET Néanmoins, quand le script essaie de se lancer, j'obtiens le message d'erreur: le système de trading a été arrêté car le code tente de définir ou d'appeler un index qui dépasse la limitation de 1000000 dans un tableau. Nous avons besoin de votre aide là dessus svp ? :)

Is it possible to backtest this in prorealtime? If yes, how can I code this. Great signals btw, thanks in advance.


Merci, Nicolas. Can this be set up as an Autotrade to order go long on the buy signal and then close on the sell signal and then vice versa? Thank you
EFFICACE