

Another RSI divergences indicator
February 25, 2019, 4:45 PM
Indicators
27 Comments
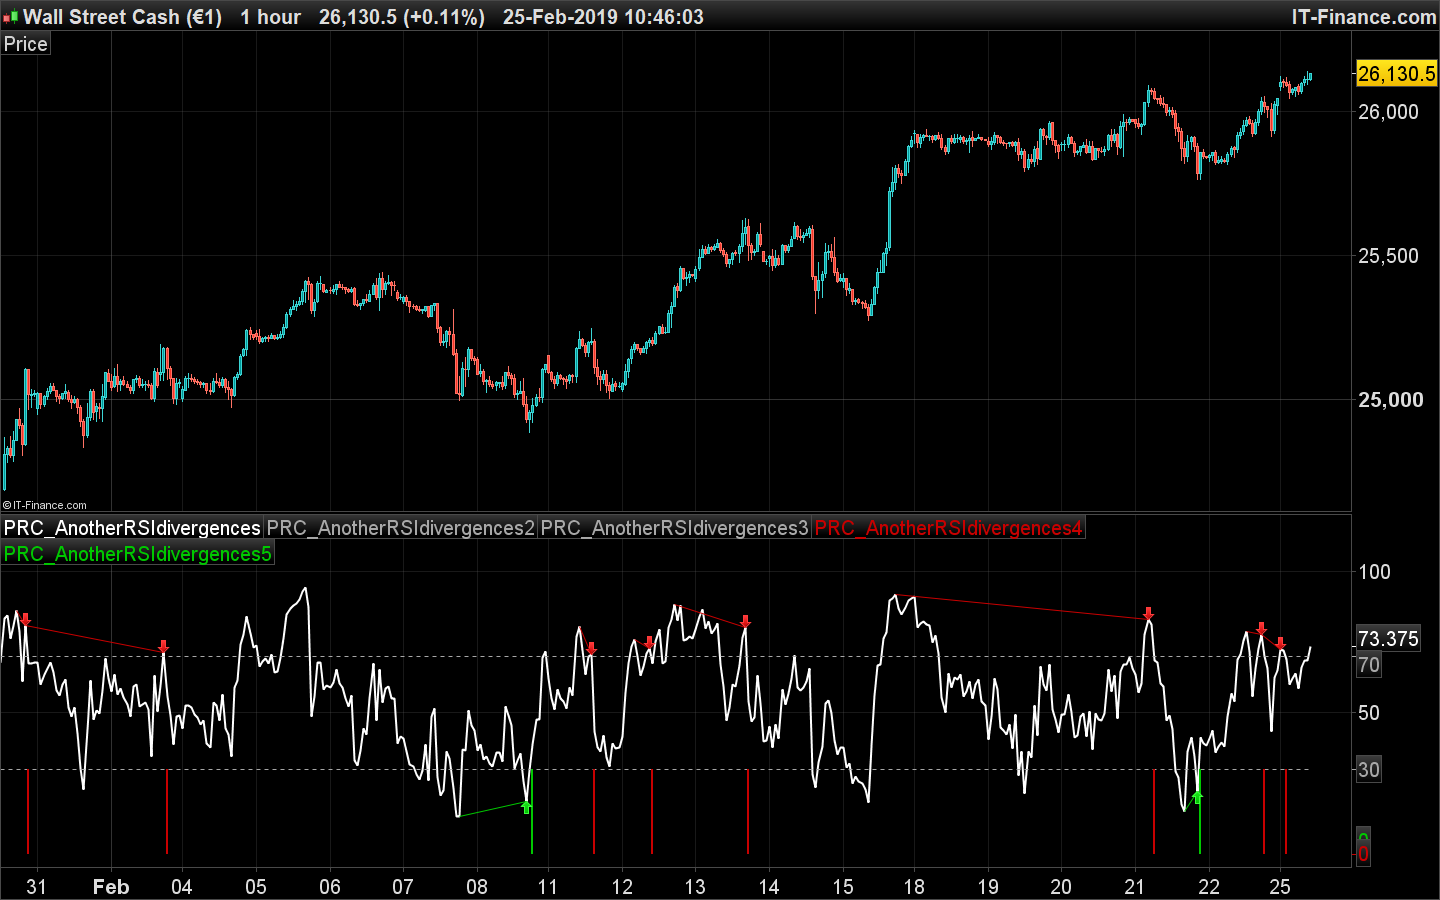
This new indicator to detect RSI divergences simply use the last two crossovers with the overbought or oversold areas of the oscillator.
Divergences are plotted on the RSI and signals are given with red/green histogram, in order to use them in a trading system.
The variable “minimalBars” is a filter to limit the detection of divergences when the RSI remains under the oversold zone or above the overbought zone of this minimum period.
//PRC_AnotherRSIdivergences | indicator
//25.02.2019
//Nicolas @ www.prorealcode.com
//Sharing ProRealTime knowledge

// --- settings
RSIp=14 //RSI period
obLevel=70 //overbought level
osLevel=30 //oversold level
minimalBars=5 //minimal count of bars where RSI is ob or os
// --- end of settings

irsi = rsi[RSIp]
ob = irsi>obLevel
os = irsi<osLevel

if ob then
 if not ob[1] then
  maxrsi = 0
  maxprice = 0
  firstobbar = barindex
 endif
 maxrsi=max(maxrsi,irsi)
 maxprice=max(maxprice,high)
 if maxrsi<>maxrsi[1] then
  maxrsibar=barindex
 endif
endif

if os then
 if not os[1] then
  minrsi = 100
  minprice = close*100
  firstosbar = barindex
 endif
 minrsi=min(minrsi,irsi)
 minprice=min(minprice,low)
 if minrsi<>minrsi[1] then
  minrsibar=barindex
 endif
endif

divsell=0
if irsi crosses under obLevel then
 //verif divergence
 div = maxprice>oldmaxprice and maxrsi<oldmaxrsi and (barindex-firstobbar)>=minimalBars
 if div then
  drawsegment(oldmaxrsibar,oldmaxrsi,maxrsibar,maxrsi) coloured(200,0,0)
  drawarrowdown(maxrsibar,maxrsi) coloured(200,0,0)
  divsell=osLevel
 endif
 oldmaxrsi = maxrsi
 oldmaxprice = maxprice
 oldmaxrsibar = maxrsibar
endif

divbuy=0
if irsi crosses over osLevel then
 //verif divergence
 div = minprice<oldminprice and minrsi>oldminrsi and (barindex-firstosbar)>=minimalBars
 if div then
  drawsegment(oldminrsibar,oldminrsi,minrsibar,minrsi) coloured(0,200,0)
  drawarrowup(minrsibar,minrsi) coloured(0,200,0)
  divbuy=osLevel
 endif
 oldminrsi = minrsi
 oldminprice = minprice
 oldminrsibar = minrsibar
endif

return irsi style(line,2) as "RSI",obLevel coloured(168,168,168) style(dottedline,1) as "overbought level", osLevel coloured(168,168,168) style(dottedline,1) as "oversold level", divsell coloured(200,0,0) style(histogram) as "sell divergence", divbuy coloured(0,200,0) style(histogram) as "buy divergence"
Download
Filename:
PRC_AnotherRSIdivergences-1.itf
Downloads:
1171
Master
I created ProRealCode because I believe in the power of shared knowledge. I spend my time coding new tools and helping members solve complex problems.
If you are stuck on a code or need a fresh perspective on a strategy, I am always willing to help. Welcome to the community!
Author’s Profile
Loading...