

All Time High (ATH) Levels
All-Time Highs (ATH) represent significant psychological barriers in financial markets. They act as “ceilings” where price discovery occurs, often triggering breakouts or strong rejections.
The ATH Levels indicator (by LuxAlgo) automates the detection of these historical peaks. Unlike a simple “Max Price” line, this tool identifies a sequence of significant historical highs and projects them forward, classifying them as dynamic Support or Resistance levels based on subsequent price action.
How it Works
This indicator scans the entire loaded history of an asset to identify every instance where a new All-Time High was established. However, simply plotting every single high would clutter the chart. To solve this, the indicator employs a smart filtering and classification system:
ATH Detection & Filtering:
The indicator tracks the global maximum price. It uses an ATR (Average True Range) filter to ensure that only distinct, significant levels are displayed. If a new ATH is too close to a previous one (based on the distMult setting), it is merged or ignored to keep the chart clean.
Dynamic Support/Resistance (S/R) Classification:
-
The indicator calculates how price interacts with each level after it was created.
-
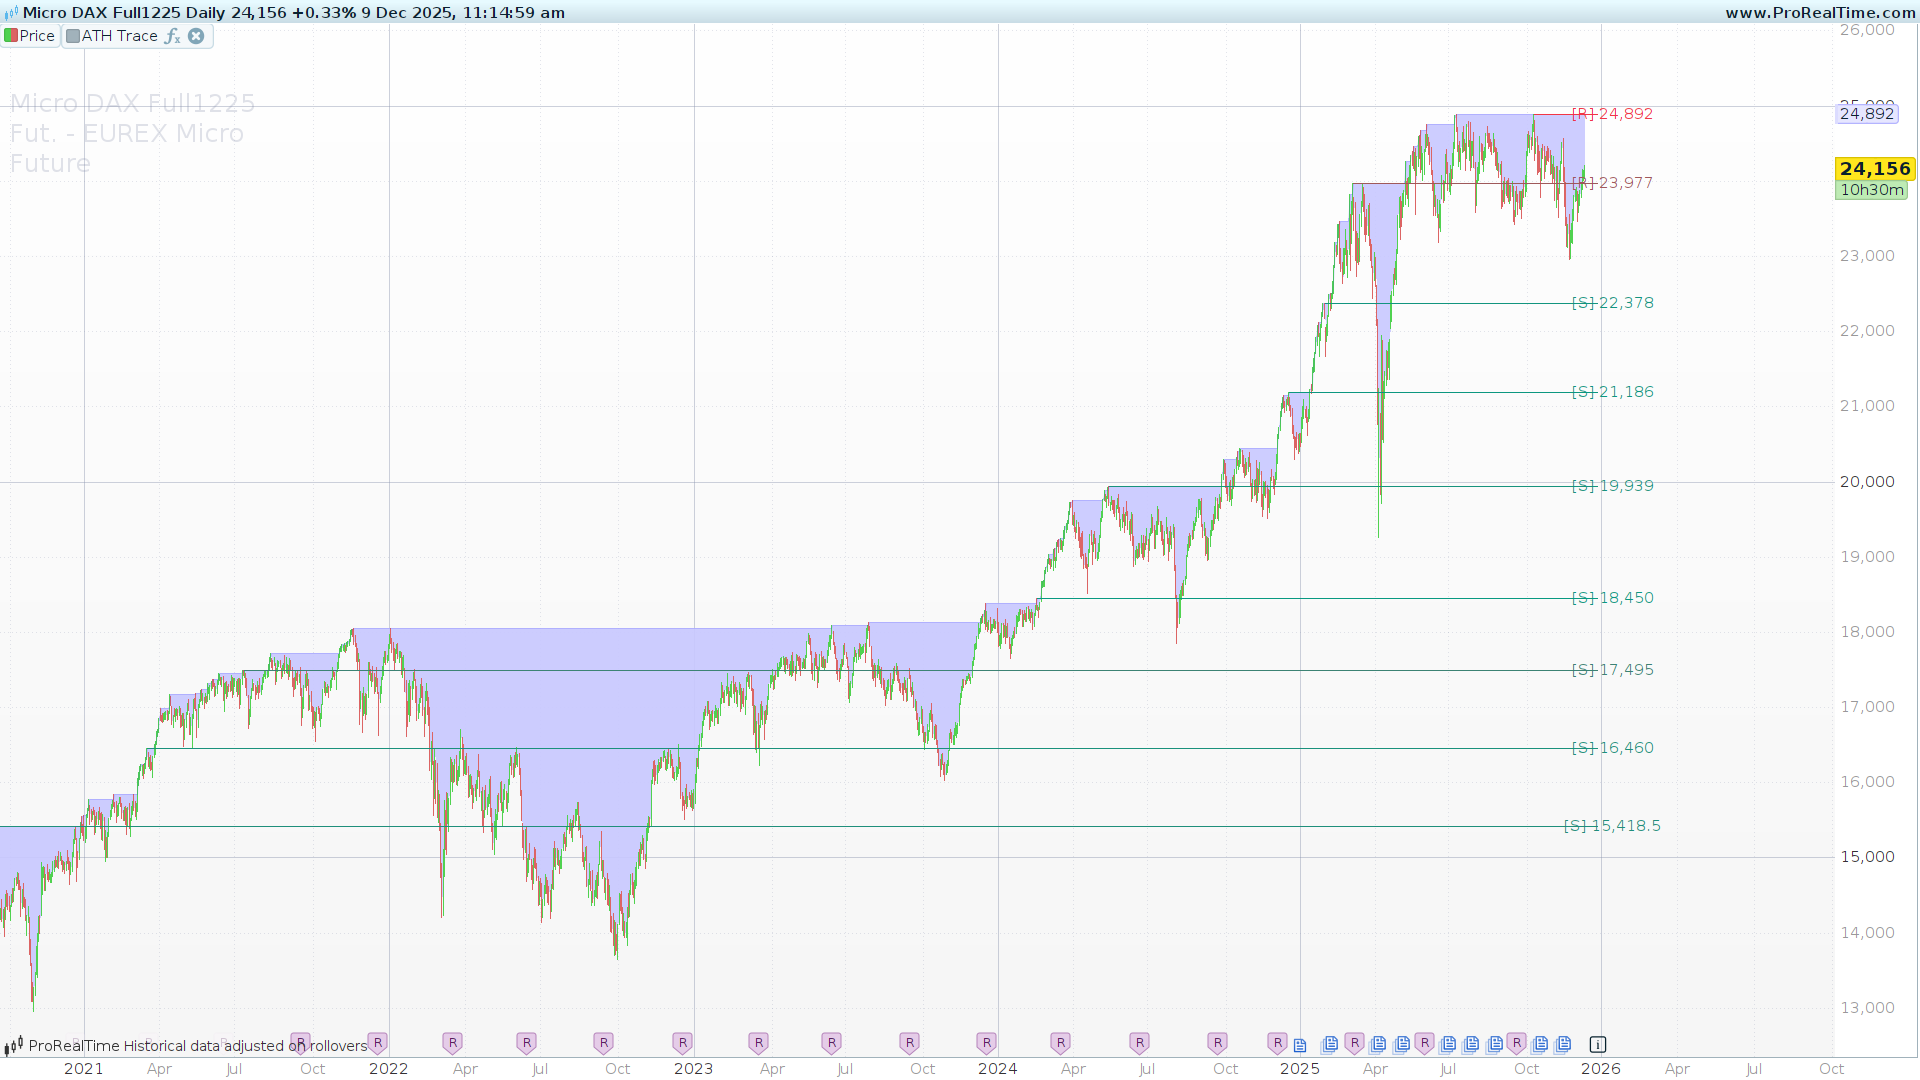
Support (Bullish – Teal): If the price spends significant time above an old ATH level, that level is considered valid Support.
-
Resistance (Bearish – Red): If the price remains below an old ATH level, it acts as Resistance.
-
Visual Gradient: The lines change color dynamically. The solid lines are drawn from the historical point of the ATH extending to the right of the current price, making it easy to identify relevant levels for the current trading session.
Note: This indicator uses DEFPARAM DrawOnLastBarOnly = True. This means it is optimized for market analysis and chart reading, drawing the lines only on the most recent update to ensure fast performance.
Settings & Configuration
You can customize the sensitivity and visual style of the indicator by modifying the variables at the beginning of the code:
-
showLast (Default: 50): Determines the maximum number of historical ATH lines to display on the chart. Reducing this number improves performance on charts with massive amounts of data.
-
duration (Default: 3): The minimum duration (in bars) required to confirm a new ATH level. Higher values filter out “noise” spikes.
-
distMult (Default: 3.0): This is the ATR Multiplier. It dictates the minimum vertical distance required between two ATH levels for them to be displayed separately.
-
Increase this value to see fewer, more significant levels.
-
Decrease this value to see more granular levels.
-
-
showClassification (Default: 1): Set to
1to display text labels ([S]for Support,[R]for Resistance) and the price level. Set to0to hide text. -
minSr (Default: 0): A filter for the strength of the Support/Resistance. Increasing this value will hide levels that are “neutral” (where price oscillates around the line without clear direction), showing only strong S/R levels.
The Code
// -----------------------------------------------
// PRC_All Time High (ATH) Levels [LuxAlgo]
// version = 0
// 09.12.2025
// Iván González @ www.prorealcode.com
// Sharing ProRealTime knowledge
// -----------------------------------------------
defparam drawonlastbaronly=true
// -----------------------------------------------
// --- Settings ---
// -----------------------------------------------
showLast = 50           // Show Last ATH
duration = 3            // ATH Minimum Duration
distMult = 3.0          // Minimum Distance Between ATH (ATR Multiplier)
showClassification = 1  // 1 = True, 0 = False (Show SR%)
minSr = 0               // Minimum % for display
// -----------------------------------------------
// --- Colors (RGB Configuration) ---
// -----------------------------------------------
// Bullish (Support) - Teal
bullR = 8
bullG = 153
bullB = 129
// Bearish (Resistance) - Red
bearR = 242
bearG = 54
bearB = 69
// -----------------------------------------------
// --- Variables Initialization ---
// -----------------------------------------------
ONCE maxPrice = 0
ONCE athCount = 0
ONCE x1 = 0
ONCE currentATR = 0
// Arrays to store ATH data
ONCE $athsValue[0] = 0 // Stores the Price Level
ONCE $athsBarIndex[0] = 0 // Stores the BarIndex of the ATH
ONCE $priceDist[0] = 0 // Cumulative distance above level
ONCE $totalPriceDist[0] = 0 // Cumulative absolute distance

// -----------------------------------------------
// 1. Track All Time High
// We check if the current High is higher than the previous global Max
// -----------------------------------------------
IF BarIndex = 0 THEN
   maxPrice = High
ELSE
   maxPrice = MAX(maxPrice, High)
ENDIF

// ATR Calculation for filtering
currentATR = AverageTrueRange[200](Close) * distMult

// Detect new ATH Candidate
IF High > maxPrice[1] THEN
   x1 = BarIndex
ENDIF
// -----------------------------------------------
// 2. Confirm ATH Recency and Store It
// -----------------------------------------------
IF BarIndex - x1 = duration THEN
   // Store data in arrays
   $athsValue[athCount] = maxPrice
   $athsBarIndex[athCount] = x1

   // Initialize distance counters for this new level
   $priceDist[athCount] = 0
   $totalPriceDist[athCount] = 0

   athCount = athCount + 1
ENDIF
// -----------------------------------------------
// 3. Update SR calculations for ALL stored ATHs
// -----------------------------------------------
IF athCount > 0 THEN
   FOR i = 0 TO athCount - 1 DO
      currentLvl = $athsValue[i]

      // Calculate distances
      distPlus = MAX(Close - currentLvl, 0)
      absDist = ABS(Close - currentLvl)

      // Accumulate in arrays
      $priceDist[i] = $priceDist[i] + distPlus
      $totalPriceDist[i] = $totalPriceDist[i] + absDist
   NEXT
ENDIF
// -----------------------------------------------
// --- Drawing Logic (Last Bar Only) ---
// -----------------------------------------------
IF IsLastBarUpdate THEN

   // 1. Draw the most recent ATH (Current Max)
   recentLvl = $athsValue[athCount - 1]
   recentIdx = $athsBarIndex[athCount - 1]

   DRAWSEGMENT(recentIdx, recentLvl, BarIndex + 10, recentLvl) COLOURED(bearR, bearG, bearB)

   IF showClassification THEN
      lev=round(recentLvl,2)
      DRAWTEXT("[R] #lev#", BarIndex + 25, recentLvl) COLOURED(bearR, bearG, bearB) ANCHOR(LEFT, INDEX, VALUE)
   ENDIF

   // 2. Draw Historical ATHs
   // We loop backwards to show the most recent ones first, respecting 'showLast'

   prevLvl = recentLvl
   countDisplayed = 0

   // Loop from the second to last stored ATH down to the first one
   // Check if athCount is sufficient to avoid loop errors
   IF athCount > 1 THEN
      FOR i = athCount - 2 DOWNTO 0 DO

         // Limit the number of lines displayed
         IF countDisplayed < showLast THEN

            currentHistLvl = $athsValue[i]
            dist = prevLvl - currentHistLvl

            // Filter: Only show if distance from previous drawn level is > ATR * Multiplier
            IF dist >= currentATR THEN

               // Calculate SR Percentage
               pDist = $priceDist[i]
               tDist = $totalPriceDist[i]

               normDist = 0
               IF tDist > 0 THEN
                  normDist = (1 - (pDist / tDist)) * 100
               ENDIF

               // Color Calculation (Gradient Simulation)
               // 0 = Full Green (Support), 100 = Full Red (Resistance)

               colorFactor = normDist / 100
               finalR = ROUND(bullR + (bearR - bullR) * colorFactor)
               finalG = ROUND(bullG + (bearG - bullG) * colorFactor)
               finalB = ROUND(bullB + (bearB - bullB) * colorFactor)

               displayPct = ABS(normDist - 50) * 2

               // Check Minimum % Filter
               IF displayPct >= minSr THEN
                  // Draw Line
                  thisX = $athsBarIndex[i]
                  DRAWSEGMENT(thisX, currentHistLvl, BarIndex + 10, currentHistLvl) COLOURED(finalR, finalG, finalB)

                  // Draw Label
                  IF showClassification THEN
                     // Determine Label (Support or Resistance)
                     lev=round(currentHistLvl,2)
                     IF normDist < 50 THEN

                        DRAWTEXT("[S] #lev#", BarIndex + 25, currentHistLvl) COLOURED(finalR, finalG, finalB) ANCHOR(LEFT, INDEX, VALUE)
                     ELSE
                        DRAWTEXT("[R] #lev#", BarIndex + 25, currentHistLvl) COLOURED(finalR, finalG, finalB) ANCHOR(LEFT, INDEX, VALUE)
                     ENDIF

                  ENDIF

                  // Update tracking variables
                  prevLvl = currentHistLvl
                  countDisplayed = countDisplayed + 1
               ENDIF
            ENDIF
         ELSE
            BREAK // Stop loop if we reached showLast limit
         ENDIF
      NEXT
   ENDIF
ENDIF
// -----------------------------------------------
// --- Background Plots ---
// -----------------------------------------------
COLORBETWEEN(Close, maxPrice, 200, 200, 255, 230) // Light Blue very transparent
// -----------------------------------------------
RETURN maxPrice AS "ATH Trace" COLOURED(0,0,255,35)
