

All the Averages Indicator
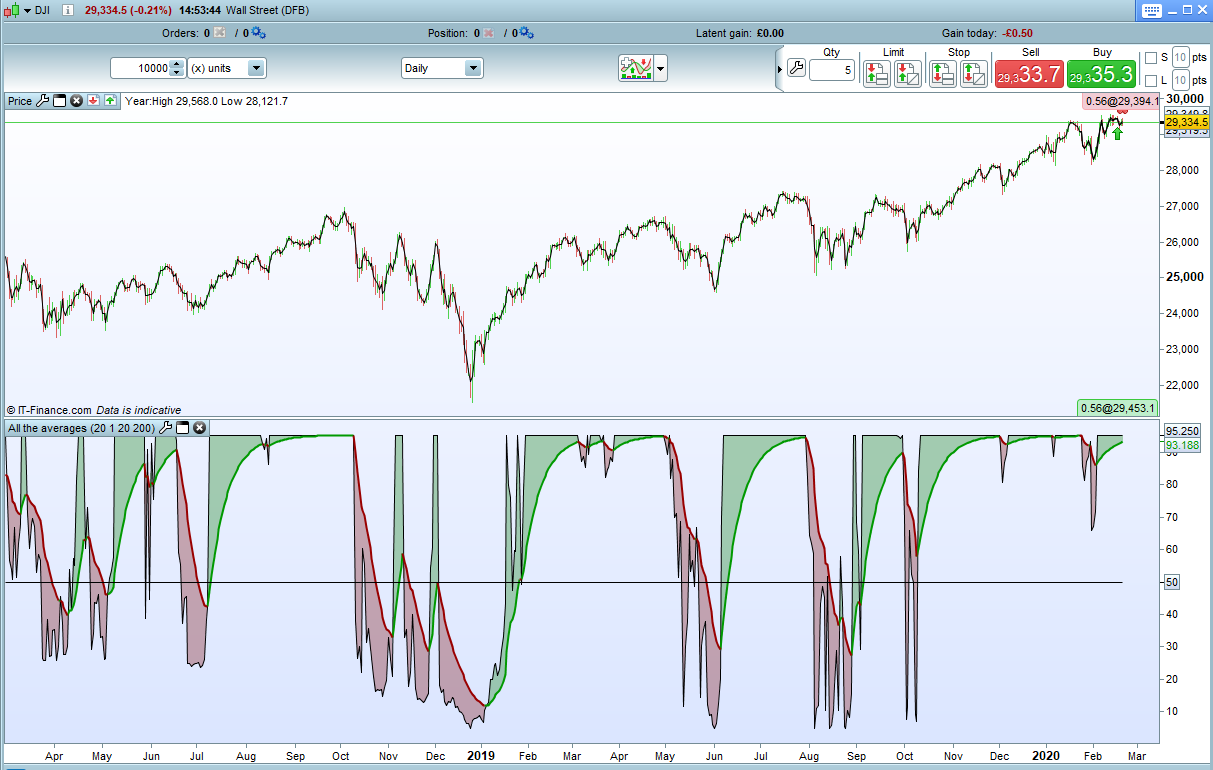
This simple indicator compares price to a large range of averages and counts how many averages the price is above or below and how many of the averages are rising or falling. It then displays the result as a value between zero and 100. An average line of period ‘p’ is also applied to the result.
Below 50 indicates strong downward strength in all the averages and above 50 strong upward strength. A crossing over of the average line can indicate a change of direction in the trend.
The indicator can be used for identifying trend direction and strength of trend or for spotting turning points in the market.
‘Startp’ is the lowest average period to be checked and ‘Endp’ the highest. All averages between these and including them are used in the calculation.
‘t’ is the average type (0 = SMA, 1 = EMA etc)
As always I advise downloading the ITF file and importing it to get full functionality.
//All The Averages Indicator
//By Vonasi
//20022020

defparam calculateonlastbars = 1000

p = 20        //average period
t = 1         //average type
startp = 20   //start of averages test range
endp = 200    //end of averages test range

total = 0
total2 = 0

for a = startp to endp
if average[a,t](customclose) > average[a,t](customclose[1]) then
total = total + 1
else
total = total - 1
endif

if customclose > average[a,t](customclose) then
total2 = total2 + 1
else
total2 = total2 - 1
endif
next

mytotal = (total+total2)/2
avg = average[p,t](mytotal)

maxp = endp*2
mytotal = mytotal + endp
avg = average[p,t](mytotal)

mytotalperc = (mytotal/maxp)*100
avg = average[p,t](mytotalperc)

return mytotalperc as "result",avg as "average",50 as "mid line"