Abstract :
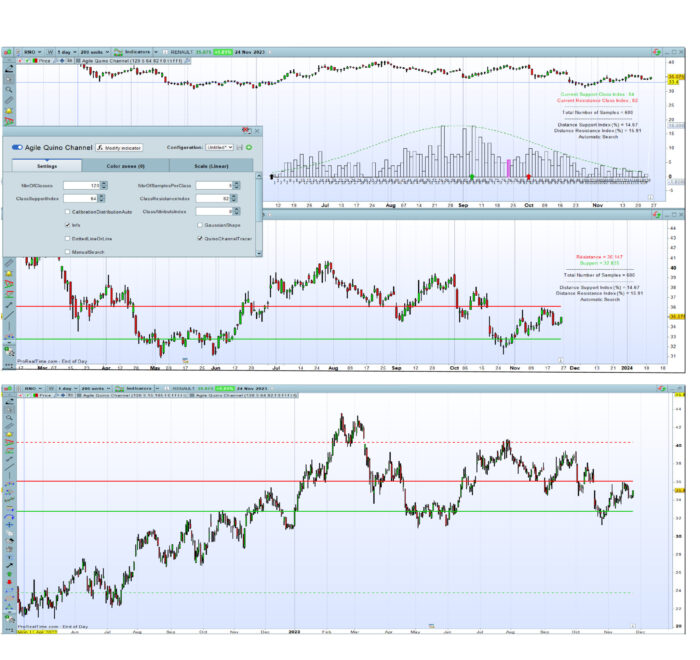
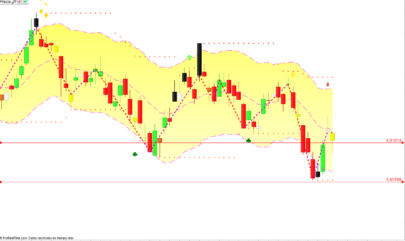
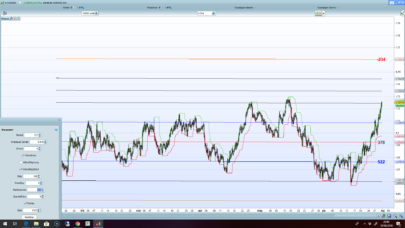
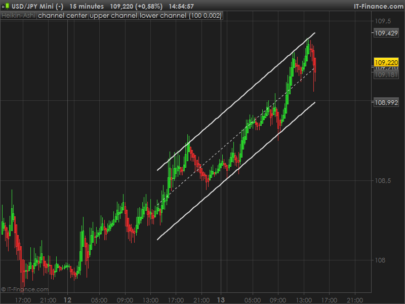
The Quino channel creates a trading path based on the statistical distribution in which a share price moves. Inserted in the price chart, it indicates where support or resistance is likely to occur. Moreover, by adding the same indicator to the price graph, it is possible to plot a short-term channel and a long-term channel by judiciously selecting the remarkable occurrences of the price distribution.
Concept :
When we observe the evolution of a share price over time, we notice that it (Close) oscillates around the same level several times over. The retracement of this level, corresponds to the behavior of Traders, linked to the psychology of the market at the different moments.
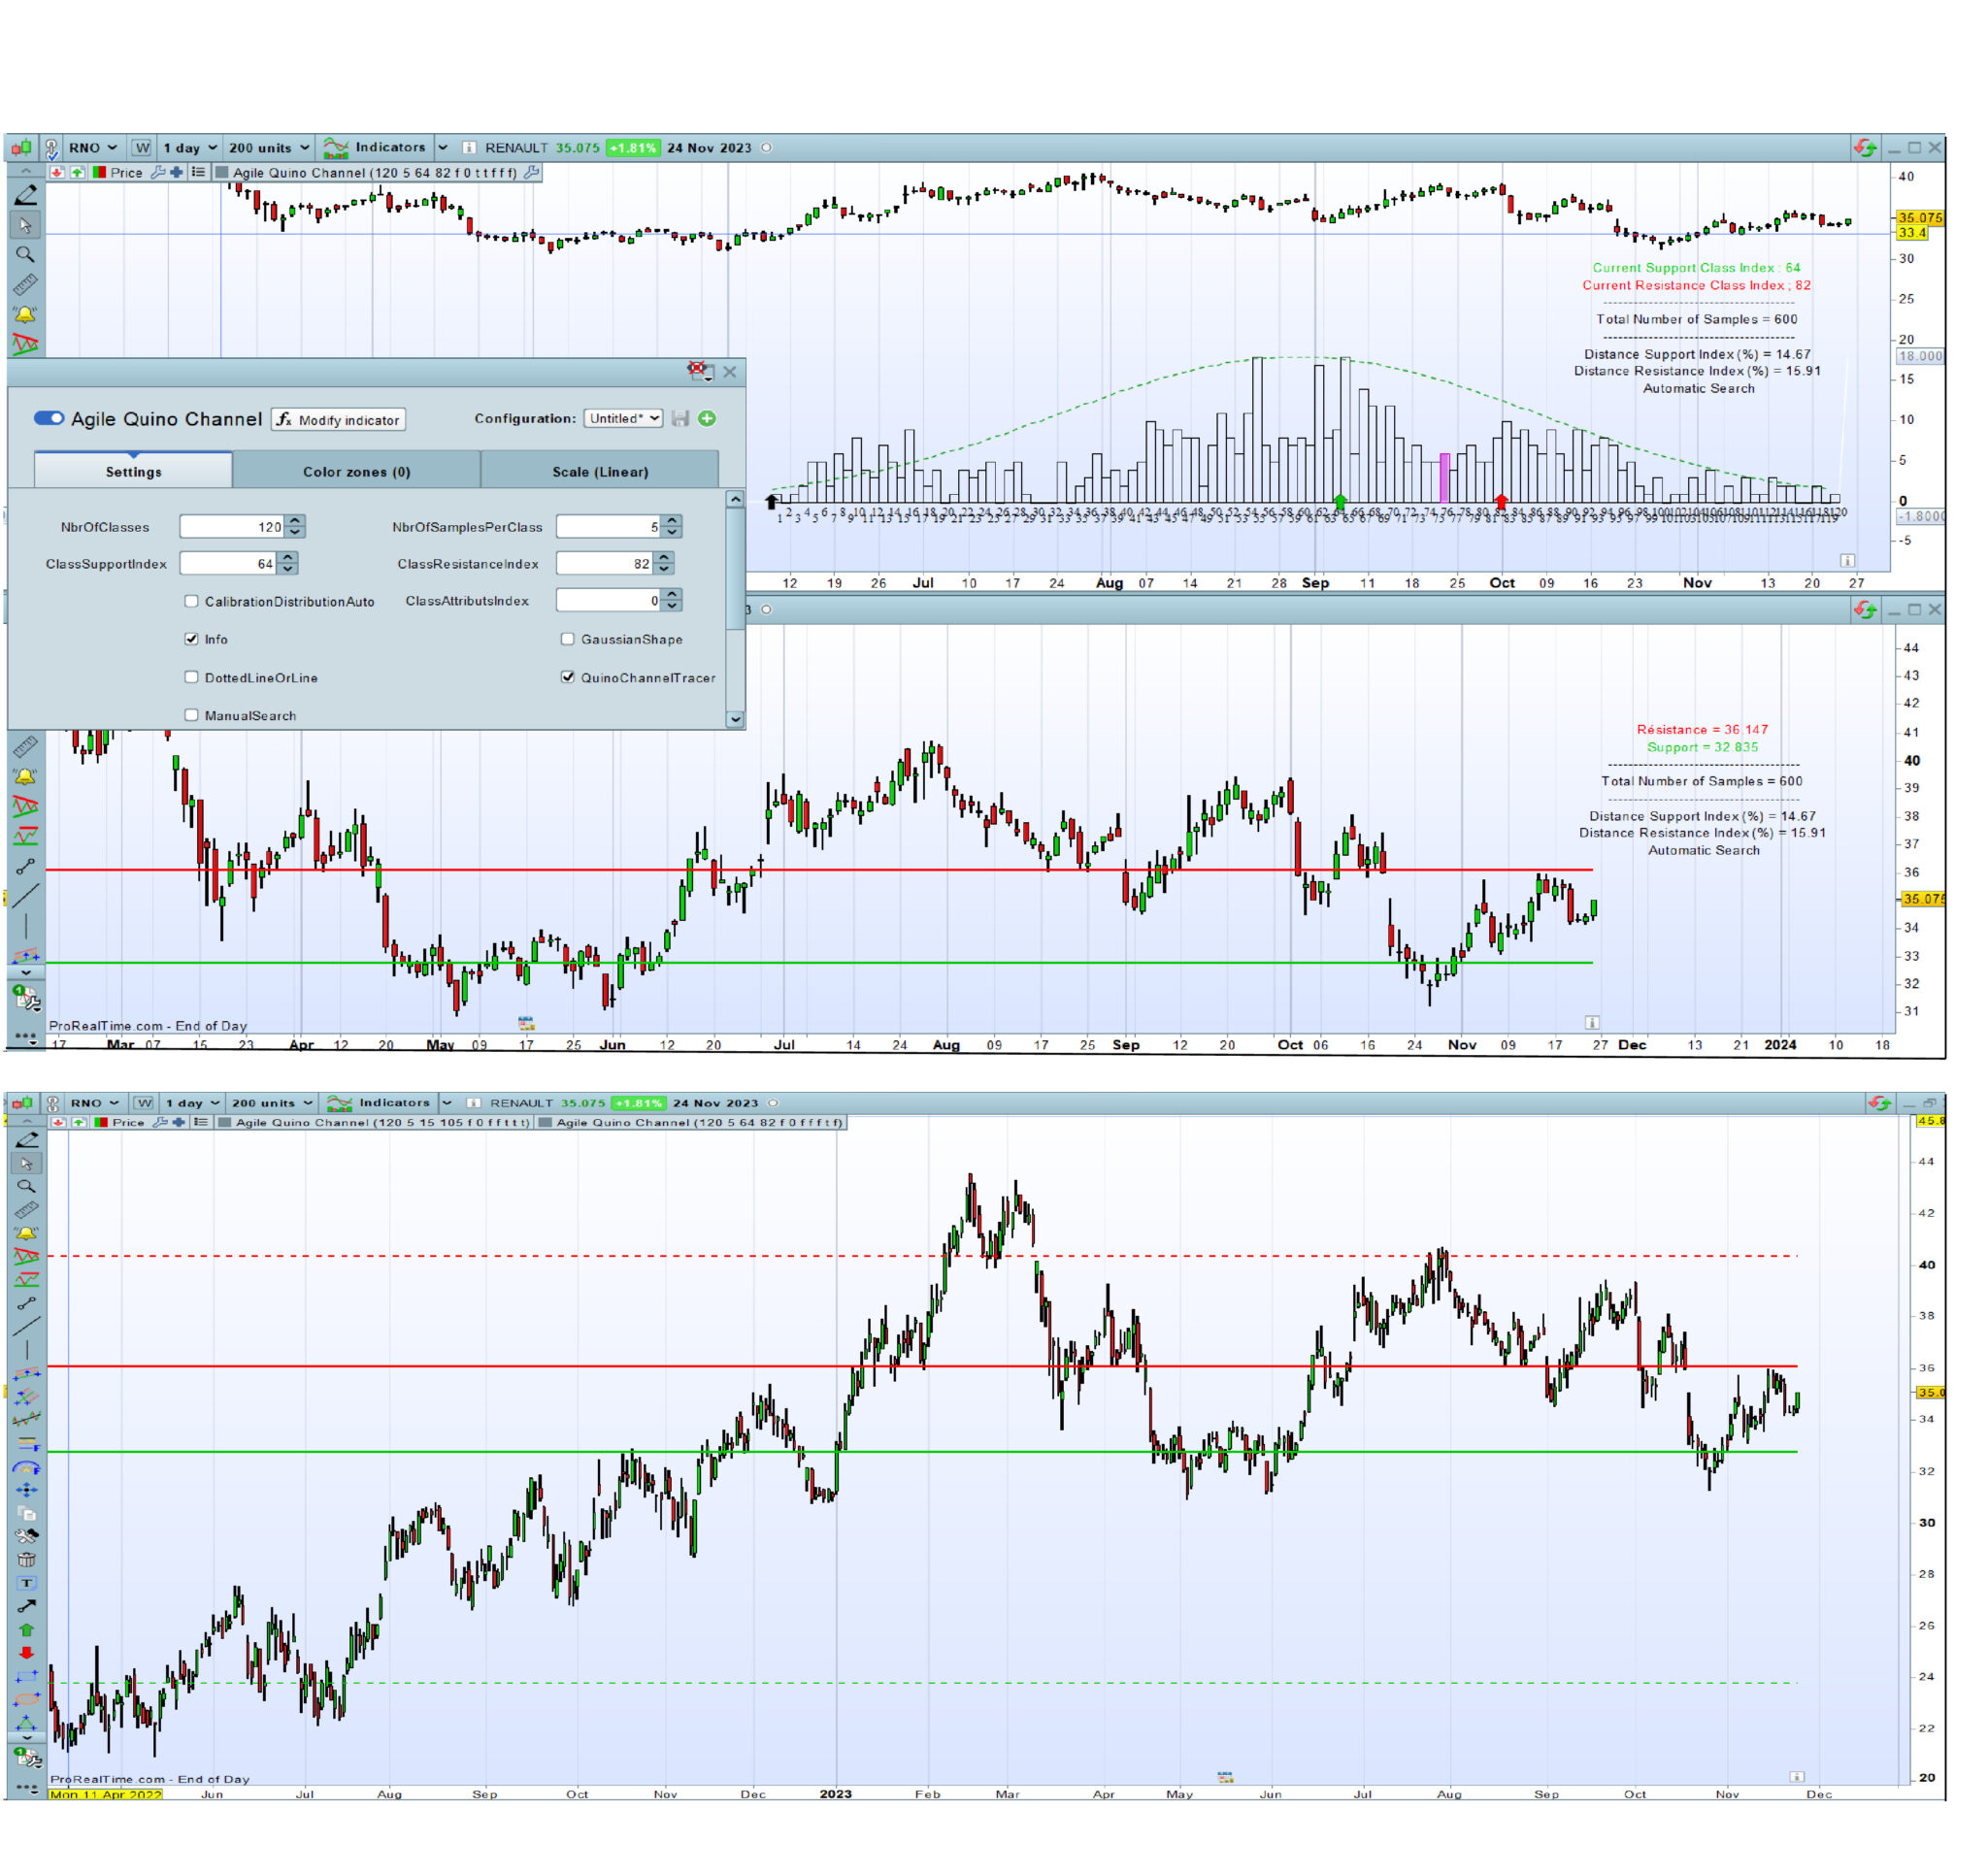
One way of spotting these remarkable levels is to construct a profile of values, formed from all the price values at defined frequencies. In other words, to construct a distribution of “Close” values over a defined number of Bars, in the shape of a histogram.
To build the histogram for a given number of bars, the “Close” values are grouped together in classes of the same dimension. Each class corresponds to an interval in which “Close” values are ranked when these values are within the upper and lower limits of the corresponding class. The amplitude of the classes (at least 5 values minimum) and the number of classes (e.g 120 values) are defined by the Trader. It corresponds to around 2 years in daily timeframe. Then, this histogram can be plot inside the price indicator or outside.
The remarkable levels appear in the histogram as peaks (sometimes in the form of bell-shaped curves) more or less close to the reference class in which the current price lies. Depending on whether these peaks are to the left or right of this reference class, a support and resistance level can be deduced, forming a horizontal “Quino Channel”, a name which differentiates this original construction method from other channel ones.
This indicator, inserted into the price graph, makes it easy to identify these remarkable support and resistance levels and to trace the channel.
By default, an automatic search mode is activated. A button allows you to switch to manual mode to search for a channel more suited to the current situation.
This automatic search identifies the highest peaks in the support histogram area and in the resistance histogram area.
In addition, this indicator allows the trader to draw a theoretical Gaussian curve on the histogram, then, to check whether it looks like a normal distribution, and even so to make statistics if this is relevant.
How to use :
Configure the time frame in daily price graph.
Choose the quantity of history suitable for the configuration selected below (Typical: 200 units).
Insert the indicator in the price graph (recommended)
Enter the following parameters in the configuration window :
– NbrOfClasses : 120 (Typical).
– NbrOfSamplesPerClass : 5 (Typical)
– ClassSupportIndex : In manual search mode ,select the value of the remarkable class index on the left of the current class (purple)
– ClassResistanceIndex : In manual search mode, select the Value of the remarkable class index on the right of the current class (purple)
– CalibrationDistributionAuto (optional) : If needed, switch on True, when the indicator is inserted in the price chart for just zooming the histogram (warning : the sample quanties are multiplied)
– ClassAttributsIndex (optional) 0 by Default. Display the attributs of the selected class if the ClassAttributsIndex > 0
– Info (optional) : Switch on True to display the chart anchored information
– GaussianShape (optional) : Switch on True to plug the theorical Gaussian shape on the historam
– DottedLineOrLine (optional) : False ; Switch on True to draw the channel in dotted lines
– QuinoChannelTracer :
By setting the QuinoChannelTracer button to False, the histogram is drawn in the price graph, allowing the selection of the remarkable peaks to the left and right of the reference class. Simply set the QuinoChannelTracer button to True to draw the channel in the price graph. Rescaling the price window may require a double click.
– Manual Search : False by default ; Switch on True to automatically search the higher peaks of class indexes.
Nb 1 : These ClassSupportIndex and ClassResistanceIndex can also be selected in stand-alone mode, outside the price graph.
Nb 2 : This indicator is a major development of an indicator I had previously created based on this principle.
Configuration backup :
All of these parameters (case of manual search) can be saved under the instrument name in the upper left corner of the indicator configuration window.
Finally
By default, the automatic search mode also starts channel tracing. This mode is useful for first-time users.
Once you’ve got to grips with this indicator, it’s very easy to use. With a single click in the indicator configuration window , it is possible to switch from the histogram, to the channel tracing in the price chart in live.
|
1 2 3 4 5 6 7 8 9 10 11 12 13 14 15 16 17 18 19 20 21 22 23 24 25 26 27 28 29 30 31 32 33 34 35 36 37 38 39 40 41 42 43 44 45 46 47 48 49 50 51 52 53 54 55 56 57 58 59 60 61 62 63 64 65 66 67 68 69 70 71 72 73 74 75 76 77 78 79 80 81 82 83 84 85 86 87 88 89 90 91 92 93 94 95 96 97 98 99 100 101 102 103 104 105 106 107 108 109 110 111 112 113 114 115 116 117 118 119 120 121 122 123 124 125 126 127 128 129 130 131 132 133 134 135 136 137 138 139 140 141 142 143 144 145 146 147 148 149 150 151 152 153 154 155 156 157 158 159 160 161 162 163 164 165 166 167 168 169 170 171 172 173 174 175 176 177 178 179 180 181 182 183 184 185 186 187 188 189 190 191 192 193 194 195 196 197 198 199 200 201 202 203 204 205 206 207 208 209 210 211 212 213 214 215 216 217 218 219 220 221 222 223 224 225 226 227 228 229 230 231 232 233 234 235 236 237 238 239 240 241 242 243 244 245 246 247 248 249 250 251 252 253 254 255 256 257 258 259 260 261 262 263 264 265 266 267 268 269 270 271 272 273 274 275 276 277 278 279 280 281 282 283 284 |
// Agile Quino Channel // Created by Quino // version of November 14, 2023 // © Copyright - Tous droits réservés // Prorealcode sharing //=================================================================================== // Standard Configuration // NbrOfClasses : Integer ; 120 (Typical); Number of intervals in which the values of "close" are ranked // NbrOfSamplesPerClass : Integer ; 5 (Typical) ; Average number of samples (close) per class // ClassSupportIndex : Integer ; Value of the class index on the left of the current class (purple) // ClassResistanceIndex : Integer ; Value of the class index on the right of the current class (purple) // CalibrationDistributionAuto : Boolean ; False (True, if needed when the indicator is inserted in the price chart for zooming the histogram) // ClassAttributsIndex : Integer ; 0 (by Default); Display the attributs of the selected class if ClassAttributsIndex > 0 // Info : Boolean ; True to display the chart anchored information // GaussianShape : Boolean : False ; True to plug the theorical Gaussian shape on the histogram // DottedLineOrLine : False ; True to draw the channel in dotted lines // QuinoChannelTracer : Boolean ; // By setting the QuinoChannelTracer button to False, the histogram is drawn in the price graph, allowing the selection of the remarkable peaks // to the left and right of the reference class. Simply set the QuinoChannelTracer button to True to draw the channel // in the price graph. Rescaling the price window may require a double-click. // ManualSearch: Boolean False ; True to automatically search the higher peaks of class indexes // // All of these parameters can be saved under the instrument name in the upper left corner of the indicator configuration window. //=========================================================================================== If NbrOfSamplesPerClass<5 or NbrOfSamplesPerClass>10 then // Nbr of samples per Class limited to the range 5-10 if info then drawtext("Error on Nbr of Samples per Class not within 5-10", -150,-75) anchor(topright)coloured (255,92,55) endif ErrorS1=1 else ErrorS1=0 endif If NbrOfClasses<30 then // // Minimum classes limited to 30 if info then drawtext("Error on Nbr of Classes < 30", -150,-90) anchor(topright)coloured (255,92,55) endif ErrorS2=1 else ErrorS2=0 endif If ClassResistanceIndex>=NbrOfClasses then if info then drawtext("Error on Class Resistance Index >= Nbr of Classes", -150,-105) anchor(topright)coloured (255,92,55) endif ErrorS3=1 else ErrorS3=0 endif If ClassSupportIndex>=NbrOfClasses then if info then drawtext("Error on Class Support Index >= Nbr of Classes", -150,-120) anchor(topright)coloured (255,92,55) endif ErrorS4=1 else ErrorS4=0 endif If ClassAttributsIndex>=NbrOfClasses then if info then drawtext("Error on Class Attributs Index >= Nbr of Classes", -150,-120) anchor(topright)coloured (255,92,55) endif ErrorS5=1 else ErrorS5=0 endif ErrorS=ErrorS1 or ErrorS2 or ErrorS3 or ErrorS4 or ErrorS5 if islastbarupdate and not ErrorS then //=========================================================================================== if CalibrationDistributionAuto and not QuinoChannelTracer then CalibartionBox=round(close/10) Coef1=max(CalibartionBox,10) if info then drawtext("Warning : Class Configuration Auto", -150,-45) anchor(topright)coloured (255,92,55) drawtext("Nbr of Samples per Class multiplied", -150,-60) anchor(topright)coloured (255,92,55) endif else Coef1=1 endif //=========================================================================================== NbrOfSamples=NbrOfClasses*NbrOfSamplesPerClass if info then drawtext("Total Number of Samples = #NbrOfSamples#", -150,-135) anchor(topright)coloured (0,0,0) drawtext("--------------------------------------", -150,-120) anchor(topright)coloured (0,0,0) drawtext("--------------------------------------", -150,-150) anchor(topright)coloured (0,0,0) endif for k =0 to NbrOfSamples-1 do $d[k]=close[k] next arraysort($d,ascend) Bin=(arraymax($d)-arraymin($d))/(NbrOfClasses) BinA=arraymin($d) for j=0 to NbrOfClasses-1 do Dtemp=0 for i=0 to NbrOfSamples-1 do if j < NbrOfClasses then if $d[i]>=BinA+ j*Bin and $d[i] <BinA+(j+1)*Bin then Dtemp=Dtemp+1 else if $d[i]>=BinA+ j*Bin and $d[i] =<BinA+(j+1)*Bin then Dtemp=Dtemp+1 endif endif endif next $r[j]=Dtemp*coef1 next Bmax=arraymax($r) Scale=Bmax //=========================================================================================== Vmoy=average[NbrOfSamples](close) Vect=std[NbrOfSamples](close) for k =0 to NbrOfClasses-1 do $Vg[k]=((exp(-0.5*square(((BinA+ k*Bin)-Vmoy)/Vect)))/Vect*sqr(6.18))*coef1 next Vgmax=arraymax($Vg) //--------------------------------------------------- for i= 0 to NbrOfClasses-1 do temp1=round((BinA+(i)*Bin),2) temp2=round((BinA+(i+1)*Bin),2) if close >= temp1 and close < temp2 then IndexRef=i endif If Bmax<Vgmax then Coef2=Vgmax/Bmax else Coef2=Bmax/Vgmax endif if GaussianShape and Not QuinoChannelTracer then drawsegment(barindex[NbrOfClasses-i+1],$Vg[i]*Coef2,barindex[NbrOfClasses-i],$Vg[i+1]*Coef2)coloured (0,150,0) style(dottedline,1) endif if GaussianShape Then Scale=max(Bmax,Vgmax*coef2) endif //=========================================================================================== For z=0 to NbrOfClasses-1 do $sup[z]= $r[z] next For z=IndexRef to NbrOfClasses-1 do $Sup[z]= 0 next for z=IndexRef+1 downto 0 do if $Sup[z]=arraymax($Sup) then Sup2=z break endif next //---------------- For z=0 to NbrOfClasses-1 do $res[z]= $r[z] next For z=0 to IndexRef do $res[z]= 0 next res=arraymax($res) for z=0 to NbrOfClasses-1 do if $res[z]=arraymax($res) then Res2=z break endif next //--------------------- if Not ManualSearch then ClassSupportIndex=Sup2 ClassResistanceIndex=Res2 endif //=========================================================================================== if Not QuinoChannelTracer then if close >= temp1 and close < temp2 then drawrectangle(barindex[NbrOfClasses-i+1],$r[i],barindex-(NbrOfClasses-i), 0)coloured(204,0,204,125) bordercolor(204,0,204) else drawrectangle(barindex[NbrOfClasses-i+1],$r[i],barindex-(NbrOfClasses-i), 0)coloured(0,0,0,0) bordercolor(0,0,0) endif endif next //=========================================================================================== if QuinoChannelTracer then ValCaseMax=(BinA+ClassSupportIndex*Bin) ValCaseMin=(BinA+(ClassSupportIndex-1)*Bin) MidCase=ValCaseMin+(ValCaseMax-ValCaseMin)/2 AfMidCase=round(MidCase,3) if ClassSupportIndex<=IndexRef then if DottedLineOrLine then drawsegment(barindex[NbrOfSamples-1-ClassSupportIndex],MidCase,barindex,MidCase)coloured (0,200,0) style(dottedline,2) else drawsegment(barindex[NbrOfSamples-1-ClassSupportIndex],MidCase,barindex,MidCase)coloured (0,200,0) style(line,2) endif if info then drawtext("Support = #AfMidCase#", -150,-105) anchor(topright)coloured (0,200,0) endif else if info then drawtext("Error - Support Class Index not on Left side", -150,-105) anchor(topright)coloured (0,200,0) endif endif else if ClassSupportIndex<=IndexRef then drawarrowup(barindex[NbrOfClasses-ClassSupportIndex+1],0) coloured(0,200,0) if info then drawtext("Current Support Class Index : #ClassSupportIndex#", -150,-90) anchor(topright)coloured (0,200,0) endif else if info then drawtext("Error - Support Class Index not on Left side", -150,-90) anchor(topright)coloured (0,200,0) endif drawarrowup(barindex[NbrOfClasses-ClassSupportIndex+1],0) coloured(220,255,200) endif endif //=========================================================================================== if QuinoChannelTracer then ValCaseMax=(BinA+ClassResistanceIndex*Bin) ValCaseMin=(BinA+(ClassResistanceIndex-1)*Bin) MidCase=ValCaseMin+(ValCaseMax-ValCaseMin)/2 AfMidCase=round(MidCase,3) if ClassResistanceIndex>IndexRef then if DottedLineOrLine then drawsegment(barindex[NbrOfSamples-1-ClassSupportIndex],MidCase,barindex,MidCase)coloured (255,0,0) style(dottedline,2) else drawsegment(barindex[NbrOfSamples-1-ClassSupportIndex],MidCase,barindex,MidCase)coloured (255,0,0) style(line,2) endif // ClassSupportIndex iso ClassResistanceIndex for alignment of channel lines if info then drawtext("Résistance = #AfMidCase#", -150,-90) anchor(topright)coloured (255,0,0) endif else drawarrowup(barindex[NbrOfClasses-ClassResistanceIndex+1],0) coloured(255,200,100) if info then drawtext("Error - Resistance Class Index not on Right side", -150,-90) anchor(topright)coloured (255,0,0) endif endif else if ClassResistanceIndex>IndexRef then drawarrowup(barindex[NbrOfClasses-ClassResistanceIndex+1],0) coloured(255,0,0) if info then drawtext("Current Resistance Class Index ; #ClassResistanceIndex#", -150,-105) anchor(topright)coloured (255,0,0) endif else if info then drawtext("Error - Resistance Class Index not on Right side", -150,-105) anchor(topright)coloured (255,0,0) endif drawarrowup(barindex[NbrOfClasses-ClassResistanceIndex+1],0) coloured(255,200,100) endif endif //=========================================================================================== if not QuinoChannelTracer then for i= 0 to NbrOfClasses-1 do Indx=i+1 IndPI=Indx mod 2 CalibClass1=-1*coef1 CalibClass2=-1.8*coef1 if IndPI=0 then drawtext("#Indx#",barindex[NbrOfClasses-i],CalibClass1,Serif,standard,10)coloured (0,0,0) else drawtext("#Indx#",barindex[NbrOfClasses-i],CalibClass2,Serif,standard,10)coloured (0,0,0) endif next drawarrowup(barindex[NbrOfClasses-ClassAttributsIndex+1],0) coloured(0,0,0) if info and ClassAttributsIndex <>0 then Class1=round((BinA+(ClassAttributsIndex-1)*Bin),3) Class2=round((BinA+(ClassAttributsIndex)*Bin),3) ClassNbr=$r[ClassAttributsIndex] drawtext("Class Index Number = #ClassAttributsIndex#", -150,-210) anchor(topright)coloured (0,0,0) drawtext("Class Samples Number = #ClassNbr#", -150,-225) anchor(topright)coloured (0,0,0) drawtext("Class Index Upper Limit = #Class2#", -150,-240) anchor(topright)coloured (0,0,0) drawtext("Class Index Lower Limit = #Class1#", -150,-255) anchor(topright)coloured (0,0,0) drawtext("--------------------------------------", -150,-150) anchor(topright)coloured (0,0,0) endif endif if info then DistSup=round((IndexRef-ClassSupportIndex)/IndexRef*100,2) DistRes=round((ClassResistanceIndex-IndexRef)/(NbrOfClasses-1-IndexRef)*100,2) drawtext("Distance Support Index (%) = #DistSup#", -150,-165) anchor(topright)coloured (0,0,0) drawtext("Distance Resistance Index (%) = #DistRes#", -150,-180) anchor(topright)coloured (0,0,0) if Not ManualSearch then drawtext("Automatic Search", -150,-195) anchor(topright)coloured (0,0,0) else drawtext("Manual Search", -150,-195) anchor(topright)coloured (0,0,0) endif endif endif //=========================================================================================== if QuinoChannelTracer then Scale=undefined CalibClass2=undefined endif return Scale as "Vertical Reference" coloured (255,255,255),CalibClass2 as "Calibration N° Class" coloured (255,255,255) |
Share this
No information on this site is investment advice or a solicitation to buy or sell any financial instrument. Past performance is not indicative of future results. Trading may expose you to risk of loss greater than your deposits and is only suitable for experienced investors who have sufficient financial means to bear such risk.
ProRealTime ITF files and other attachments :PRC is also on YouTube, subscribe to our channel for exclusive content and tutorials
