

Agile Quino Channel
Abstract :
The Quino channel creates a trading path based on the statistical distribution in which a share price moves. Inserted in the price chart, it indicates where support or resistance is likely to occur. Moreover, by adding the same indicator to the price graph, it is possible to plot a short-term channel and a long-term channel by judiciously selecting the remarkable occurrences of the price distribution.
Concept :
When we observe the evolution of a share price over time, we notice that it (Close) oscillates around the same level several times over. The retracement of this level, corresponds to the behavior of Traders, linked to the psychology of the market at the different moments.
One way of spotting these remarkable levels is to construct a profile of values, formed from all the price values at defined frequencies. In other words, to construct a distribution of “Close” values over a defined number of Bars, in the shape of a histogram.
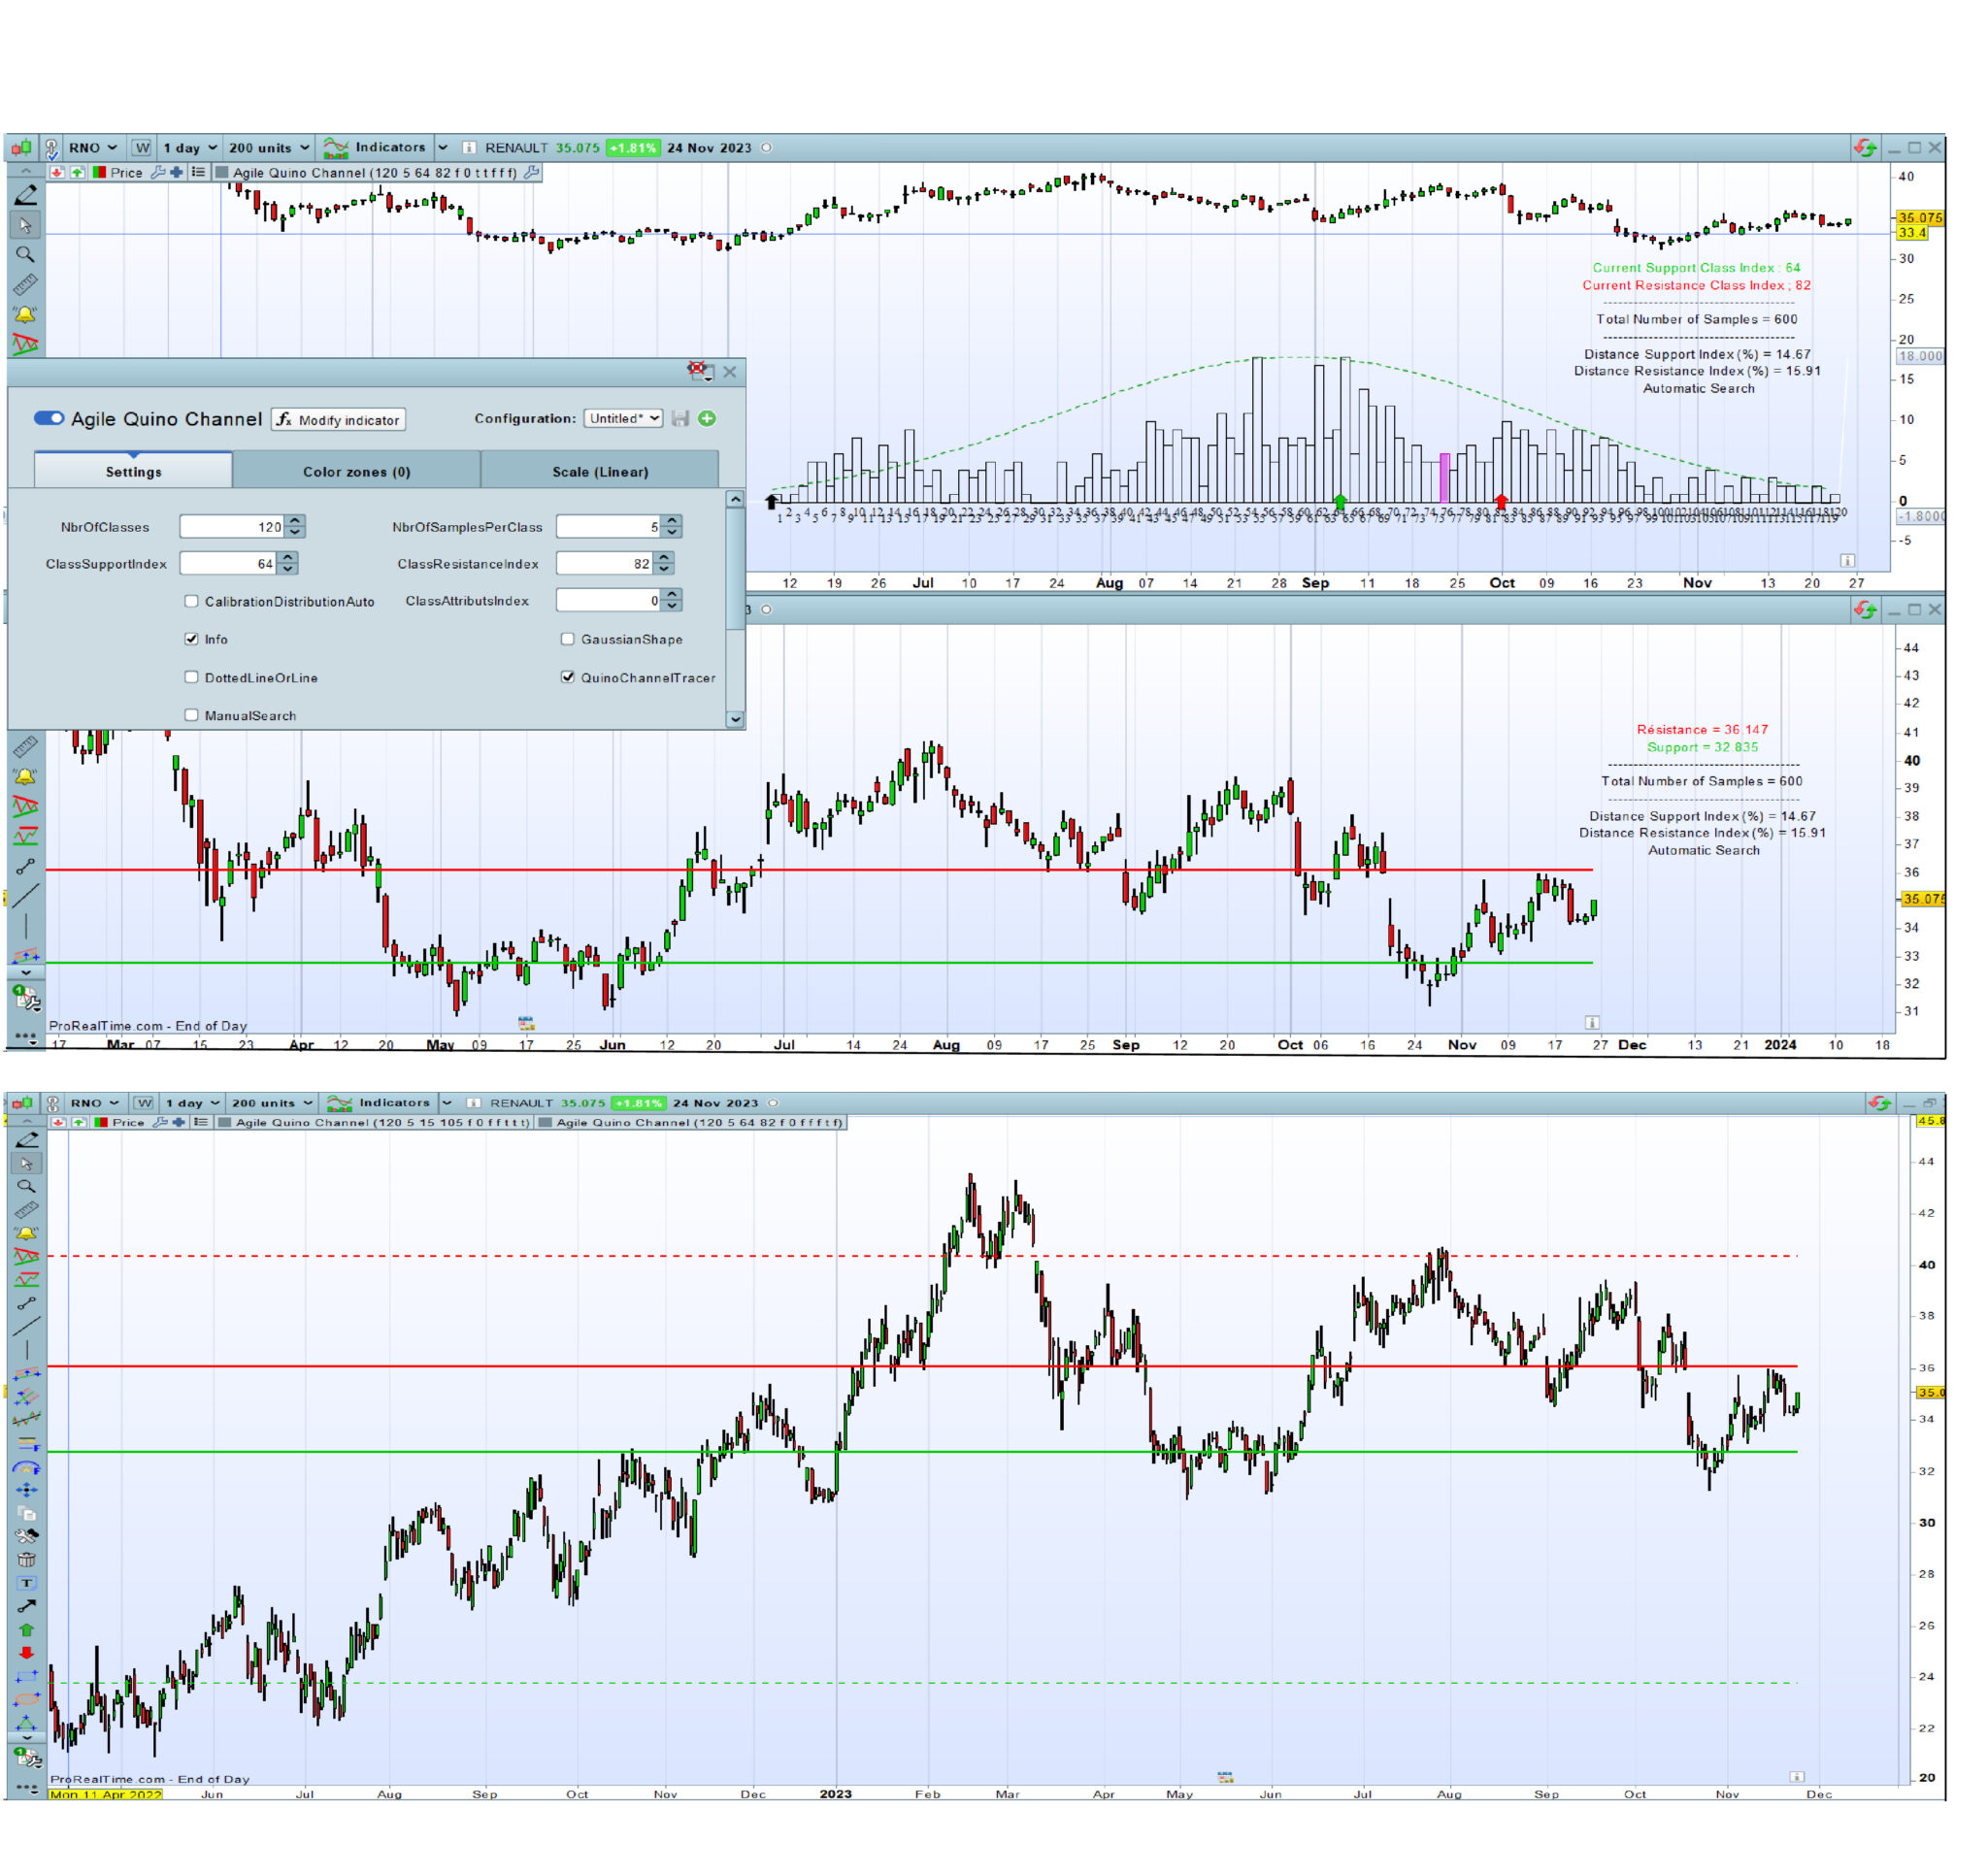
To build the histogram for a given number of bars, the “Close” values are grouped together in classes of the same dimension. Each class corresponds to an interval in which “Close” values are ranked when these values are within the upper and lower limits of the corresponding class. The amplitude of the classes (at least 5 values minimum) and the number of classes (e.g 120 values) are defined by the Trader. It corresponds to around 2 years in daily timeframe. Then, this histogram can be plot inside the price indicator or outside.
The remarkable levels appear in the histogram as peaks (sometimes in the form of bell-shaped curves) more or less close to the reference class in which the current price lies. Depending on whether these peaks are to the left or right of this reference class, a support and resistance level can be deduced, forming a horizontal “Quino Channel”, a name which differentiates this original construction method from other channel ones.
This indicator, inserted into the price graph, makes it easy to identify these remarkable support and resistance levels and to trace the channel.
By default, an automatic search mode is activated. A button allows you to switch to manual mode to search for a channel more suited to the current situation.
This automatic search identifies the highest peaks in the support histogram area and in the resistance histogram area.
In addition, this indicator allows the trader to draw a theoretical Gaussian curve on the histogram, then, to check whether it looks like a normal distribution, and even so to make statistics if this is relevant.
How to use :
Configure the time frame in daily price graph.
Choose the quantity of history suitable for the configuration selected below (Typical: 200 units).
Insert the indicator in the price graph (recommended)
Enter the following parameters in the configuration window :
– NbrOfClasses : 120 (Typical).
– NbrOfSamplesPerClass : 5 (Typical)
– ClassSupportIndex : In manual search mode ,select the value of the remarkable class index on the left of the current class (purple)
– ClassResistanceIndex : In manual search mode, select the Value of the remarkable class index on the right of the current class (purple)
– CalibrationDistributionAuto (optional) : If needed, switch on True, when the indicator is inserted in the price chart for just zooming the histogram (warning : the sample quanties are multiplied)
– ClassAttributsIndex (optional) 0 by Default. Display the attributs of the selected class if the ClassAttributsIndex > 0
– Info (optional) : Switch on True to display the chart anchored information
– GaussianShape (optional) : Switch on True to plug the theorical Gaussian shape on the historam
– DottedLineOrLine (optional) : False ; Switch on True to draw the channel in dotted lines
– QuinoChannelTracer :
By setting the QuinoChannelTracer button to False, the histogram is drawn in the price graph, allowing the selection of the remarkable peaks to the left and right of the reference class. Simply set the QuinoChannelTracer button to True to draw the channel in the price graph. Rescaling the price window may require a double click.
– Manual Search : False by default ; Switch on True to automatically search the higher peaks of class indexes.
Nb 1 : These ClassSupportIndex and ClassResistanceIndex can also be selected in stand-alone mode, outside the price graph.
Nb 2 : This indicator is a major development of an indicator I had previously created based on this principle.
Configuration backup :
All of these parameters (case of manual search) can be saved under the instrument name in the upper left corner of the indicator configuration window.
Finally
By default, the automatic search mode also starts channel tracing. This mode is useful for first-time users.
Once you’ve got to grips with this indicator, it’s very easy to use. With a single click in the indicator configuration window , it is possible to switch from the histogram, to the channel tracing in the price chart in live.
// Agile Quino Channel
// Created by Quino
// version of November 14, 2023
// © Copyright - Tous droits réservés
// Prorealcode sharing
//===================================================================================
// Standard Configuration
// NbrOfClasses : Integer ; 120 (Typical); Number of intervals in which the values of "close" are ranked
// NbrOfSamplesPerClass : Integer ; 5 (Typical) ; Average number of samples (close) per class
// ClassSupportIndex : Integer ; Value of the class index on the left of the current class (purple)
// ClassResistanceIndex : Integer ; Value of the class index on the right of the current class (purple)
// CalibrationDistributionAuto : Boolean ; False (True, if needed when the indicator is inserted in the price chart for zooming the histogram)
// ClassAttributsIndex : Integer ; 0 (by Default); Display the attributs of the selected class if ClassAttributsIndex > 0
// Info : Boolean ; True to display the chart anchored information
// GaussianShape : Boolean : False ; True to plug the theorical Gaussian shape on the histogram
// DottedLineOrLine : False ; True to draw the channel in dotted lines
// QuinoChannelTracer : Boolean ;
// By setting the QuinoChannelTracer button to False, the histogram is drawn in the price graph, allowing the selection of the remarkable peaks
// to the left and right of the reference class. Simply set the QuinoChannelTracer button to True to draw the channel
// in the price graph. Rescaling the price window may require a double-click.
// ManualSearch: Boolean False ; True to automatically search the higher peaks of class indexes
//
// All of these parameters can be saved under the instrument name in the upper left corner of the indicator configuration window.
//===========================================================================================
If NbrOfSamplesPerClass<5 or NbrOfSamplesPerClass>10 then // Nbr of samples per Class limited to the range 5-10
if info then
drawtext("Error on Nbr of Samples per Class not within 5-10", -150,-75) anchor(topright)coloured (255,92,55)
endif
ErrorS1=1
else
ErrorS1=0
endif
If NbrOfClasses<30 then // // Minimum classes limited to 30
if info then
drawtext("Error on Nbr of Classes < 30", -150,-90) anchor(topright)coloured (255,92,55)
endif
ErrorS2=1
else
ErrorS2=0
endif
If ClassResistanceIndex>=NbrOfClasses then
if info then
drawtext("Error on Class Resistance Index >= Nbr of Classes", -150,-105) anchor(topright)coloured (255,92,55)
endif
ErrorS3=1
else
ErrorS3=0
endif
If ClassSupportIndex>=NbrOfClasses then
if info then
drawtext("Error on Class Support Index >= Nbr of Classes", -150,-120) anchor(topright)coloured (255,92,55)
endif
ErrorS4=1
else
ErrorS4=0
endif
If ClassAttributsIndex>=NbrOfClasses then
if info then
drawtext("Error on Class Attributs Index >= Nbr of Classes", -150,-120) anchor(topright)coloured (255,92,55)
endif
ErrorS5=1
else
ErrorS5=0
endif
ErrorS=ErrorS1 or ErrorS2 or ErrorS3 or ErrorS4 or ErrorS5
if islastbarupdate and not ErrorS then
//===========================================================================================
if CalibrationDistributionAuto and not QuinoChannelTracer then
CalibartionBox=round(close/10)
Coef1=max(CalibartionBox,10)
if info then
drawtext("Warning : Class Configuration Auto", -150,-45) anchor(topright)coloured (255,92,55)
drawtext("Nbr of Samples per Class multiplied", -150,-60) anchor(topright)coloured (255,92,55)
endif
else
Coef1=1
endif
//===========================================================================================
NbrOfSamples=NbrOfClasses*NbrOfSamplesPerClass
if info then
drawtext("Total Number of Samples = #NbrOfSamples#", -150,-135) anchor(topright)coloured (0,0,0)
drawtext("--------------------------------------", -150,-120) anchor(topright)coloured (0,0,0)
drawtext("--------------------------------------", -150,-150) anchor(topright)coloured (0,0,0)
endif
for k =0 to NbrOfSamples-1 do
$d[k]=close[k]
next
arraysort($d,ascend)
Bin=(arraymax($d)-arraymin($d))/(NbrOfClasses)
BinA=arraymin($d)
for j=0 to NbrOfClasses-1 do
Dtemp=0
for i=0 to NbrOfSamples-1 do
if j < NbrOfClasses then
if $d[i]>=BinA+ j*Bin and $d[i] <BinA+(j+1)*Bin then
Dtemp=Dtemp+1
else
if $d[i]>=BinA+ j*Bin and $d[i] =<BinA+(j+1)*Bin then
Dtemp=Dtemp+1
endif
endif
endif
next
$r[j]=Dtemp*coef1
next
Bmax=arraymax($r)
Scale=Bmax
//===========================================================================================
Vmoy=average[NbrOfSamples](close)
Vect=std[NbrOfSamples](close)
for k =0 to NbrOfClasses-1 do
$Vg[k]=((exp(-0.5*square(((BinA+ k*Bin)-Vmoy)/Vect)))/Vect*sqr(6.18))*coef1
next
Vgmax=arraymax($Vg)
//---------------------------------------------------
for i= 0 to NbrOfClasses-1 do
temp1=round((BinA+(i)*Bin),2)
temp2=round((BinA+(i+1)*Bin),2)
if close >= temp1 and close < temp2 then
IndexRef=i
endif
If Bmax<Vgmax then
Coef2=Vgmax/Bmax
else
Coef2=Bmax/Vgmax
endif
if GaussianShape and Not QuinoChannelTracer then
drawsegment(barindex[NbrOfClasses-i+1],$Vg[i]*Coef2,barindex[NbrOfClasses-i],$Vg[i+1]*Coef2)coloured (0,150,0) style(dottedline,1)
endif
if GaussianShape Then
Scale=max(Bmax,Vgmax*coef2)
endif
//===========================================================================================
For z=0 to NbrOfClasses-1 do
$sup[z]= $r[z]
next
For z=IndexRef to NbrOfClasses-1 do
$Sup[z]= 0
next
for z=IndexRef+1 downto 0 do
if $Sup[z]=arraymax($Sup) then
Sup2=z
break
endif
next
//----------------
For z=0 to NbrOfClasses-1 do
$res[z]= $r[z]
next
For z=0 to IndexRef do
$res[z]= 0
next
res=arraymax($res)
for z=0 to NbrOfClasses-1 do
if $res[z]=arraymax($res) then
Res2=z
break
endif
next
//---------------------
if Not ManualSearch then
ClassSupportIndex=Sup2
ClassResistanceIndex=Res2
endif
//===========================================================================================
if Not QuinoChannelTracer then
if close >= temp1 and close < temp2 then
drawrectangle(barindex[NbrOfClasses-i+1],$r[i],barindex-(NbrOfClasses-i), 0)coloured(204,0,204,125) bordercolor(204,0,204)
else
drawrectangle(barindex[NbrOfClasses-i+1],$r[i],barindex-(NbrOfClasses-i), 0)coloured(0,0,0,0) bordercolor(0,0,0)
endif
endif
next
//===========================================================================================
if QuinoChannelTracer then
ValCaseMax=(BinA+ClassSupportIndex*Bin)
ValCaseMin=(BinA+(ClassSupportIndex-1)*Bin)
MidCase=ValCaseMin+(ValCaseMax-ValCaseMin)/2
AfMidCase=round(MidCase,3)
if ClassSupportIndex<=IndexRef then
if DottedLineOrLine then
drawsegment(barindex[NbrOfSamples-1-ClassSupportIndex],MidCase,barindex,MidCase)coloured (0,200,0) style(dottedline,2)
else
drawsegment(barindex[NbrOfSamples-1-ClassSupportIndex],MidCase,barindex,MidCase)coloured (0,200,0) style(line,2)
endif
if info then
drawtext("Support = #AfMidCase#", -150,-105) anchor(topright)coloured (0,200,0)
endif
else
if info then
drawtext("Error - Support Class Index not on Left side", -150,-105) anchor(topright)coloured (0,200,0)
endif
endif
else
if ClassSupportIndex<=IndexRef then
drawarrowup(barindex[NbrOfClasses-ClassSupportIndex+1],0) coloured(0,200,0)
if info then
drawtext("Current Support Class Index : #ClassSupportIndex#", -150,-90) anchor(topright)coloured (0,200,0)
endif
else
if info then
drawtext("Error - Support Class Index not on Left side", -150,-90) anchor(topright)coloured (0,200,0)
endif
drawarrowup(barindex[NbrOfClasses-ClassSupportIndex+1],0) coloured(220,255,200)
endif
endif
//===========================================================================================
if QuinoChannelTracer then
ValCaseMax=(BinA+ClassResistanceIndex*Bin)
ValCaseMin=(BinA+(ClassResistanceIndex-1)*Bin)
MidCase=ValCaseMin+(ValCaseMax-ValCaseMin)/2
AfMidCase=round(MidCase,3)
if ClassResistanceIndex>IndexRef then
if DottedLineOrLine then
drawsegment(barindex[NbrOfSamples-1-ClassSupportIndex],MidCase,barindex,MidCase)coloured (255,0,0) style(dottedline,2)
else
drawsegment(barindex[NbrOfSamples-1-ClassSupportIndex],MidCase,barindex,MidCase)coloured (255,0,0) style(line,2)
endif
// ClassSupportIndex iso ClassResistanceIndex for alignment of channel lines
if info then
drawtext("Résistance = #AfMidCase#", -150,-90) anchor(topright)coloured (255,0,0)
endif
else
drawarrowup(barindex[NbrOfClasses-ClassResistanceIndex+1],0) coloured(255,200,100)
if info then
drawtext("Error - Resistance Class Index not on Right side", -150,-90) anchor(topright)coloured (255,0,0)
endif
endif
else
if ClassResistanceIndex>IndexRef then
drawarrowup(barindex[NbrOfClasses-ClassResistanceIndex+1],0) coloured(255,0,0)
if info then
drawtext("Current Resistance Class Index ; #ClassResistanceIndex#", -150,-105) anchor(topright)coloured (255,0,0)
endif
else
if info then
drawtext("Error - Resistance Class Index not on Right side", -150,-105) anchor(topright)coloured (255,0,0)
endif
drawarrowup(barindex[NbrOfClasses-ClassResistanceIndex+1],0) coloured(255,200,100)
endif
endif
//===========================================================================================
if not QuinoChannelTracer then
for i= 0 to NbrOfClasses-1 do
Indx=i+1
IndPI=Indx mod 2
CalibClass1=-1*coef1
CalibClass2=-1.8*coef1
if IndPI=0 then
drawtext("#Indx#",barindex[NbrOfClasses-i],CalibClass1,Serif,standard,10)coloured (0,0,0)
else
drawtext("#Indx#",barindex[NbrOfClasses-i],CalibClass2,Serif,standard,10)coloured (0,0,0)
endif
next
drawarrowup(barindex[NbrOfClasses-ClassAttributsIndex+1],0) coloured(0,0,0)
if info and ClassAttributsIndex <>0 then
Class1=round((BinA+(ClassAttributsIndex-1)*Bin),3)
Class2=round((BinA+(ClassAttributsIndex)*Bin),3)
ClassNbr=$r[ClassAttributsIndex]
drawtext("Class Index Number = #ClassAttributsIndex#", -150,-210) anchor(topright)coloured (0,0,0)
drawtext("Class Samples Number = #ClassNbr#", -150,-225) anchor(topright)coloured (0,0,0)
drawtext("Class Index Upper Limit = #Class2#", -150,-240) anchor(topright)coloured (0,0,0)
drawtext("Class Index Lower Limit = #Class1#", -150,-255) anchor(topright)coloured (0,0,0)
drawtext("--------------------------------------", -150,-150) anchor(topright)coloured (0,0,0)
endif
endif
if info then
DistSup=round((IndexRef-ClassSupportIndex)/IndexRef*100,2)
DistRes=round((ClassResistanceIndex-IndexRef)/(NbrOfClasses-1-IndexRef)*100,2)
drawtext("Distance Support Index (%) = #DistSup#", -150,-165) anchor(topright)coloured (0,0,0)
drawtext("Distance Resistance Index (%) = #DistRes#", -150,-180) anchor(topright)coloured (0,0,0)
if Not ManualSearch then
drawtext("Automatic Search", -150,-195) anchor(topright)coloured (0,0,0)
else
drawtext("Manual Search", -150,-195) anchor(topright)coloured (0,0,0)
endif
endif
endif
//===========================================================================================
if QuinoChannelTracer then
Scale=undefined
CalibClass2=undefined
endif
return Scale as "Vertical Reference" coloured (255,255,255),CalibClass2 as "Calibration N° Class" coloured (255,255,255)