

Adaptive Trend Channel
1. Introduction
Most trend channel indicators force you to choose a single lookback period. Pick too short and the channel whipsaws on noise; pick too long and it misses recent structure. The Adaptive Trend Channel solves this by scanning multiple candidate periods simultaneously and selecting the one that best fits the current market structure.
Originally developed for TradingView by Julien_Exe, this indicator has been adapted to ProBuilder for ProRealTime. It evaluates each candidate channel through a multi-factor scoring system — combining statistical fit, trend strength, containment quality, and stability — to find the most reliable trend channel at any given time.
2. How It Works
The indicator builds regression-based channels for a range of lookback periods, then ranks them using a Robust Composite Score. The process works as follows:
Step 1 — Build candidate channels. For each tested period, the indicator computes a linear regression line through the price data. The channel is formed by adding and subtracting a multiple of the standard deviation from this regression line.
Step 2 — Score each candidate. Five quality metrics are calculated and combined:
- Trend Efficiency (40% weight): Ratio of directional movement to noise. High values mean the trend is clean relative to the scatter.
- Pearson r (25%): Linear correlation coefficient. Measures how well price follows a straight line over the lookback period.
- Channel Width (10%): Penalizes excessively wide channels that provide little practical guidance.
- Containment (7%): Fraction of bars that fall within the channel bands. A good channel should contain most of the price action.
- ADX (3%): Native trend strength filter to avoid fitting channels to choppy, directionless markets.
Step 3 — Check eligibility. Each candidate must pass minimum thresholds for Pearson r, ADX, containment ratio, and maximum width. Candidates that pass are displayed in blue (eligible); if none pass, the best available fallback is shown in gray (ineligible).
Step 4 — Stability bonus. Candidates whose neighbors (slightly shorter and longer periods) produce similar scores receive a stability bonus. This favors channels that are not just locally good but robust to small changes in period length.
3. Two Time Horizons
The indicator runs the selection process independently for two time horizons:
- Short-Term Channel (labeled ST): Scans 12 candidate periods from 20 to 200 bars. Tracks the active market structure and recent trend direction.
- Long-Term Channel (labeled LT): Scans 10 candidate periods from 300 to 1200 bars, with relaxed eligibility thresholds. Frames the broader trend context.
Both channels adapt independently — the short-term channel might select a 90-bar regression while the long-term selects 650, depending on current market conditions.
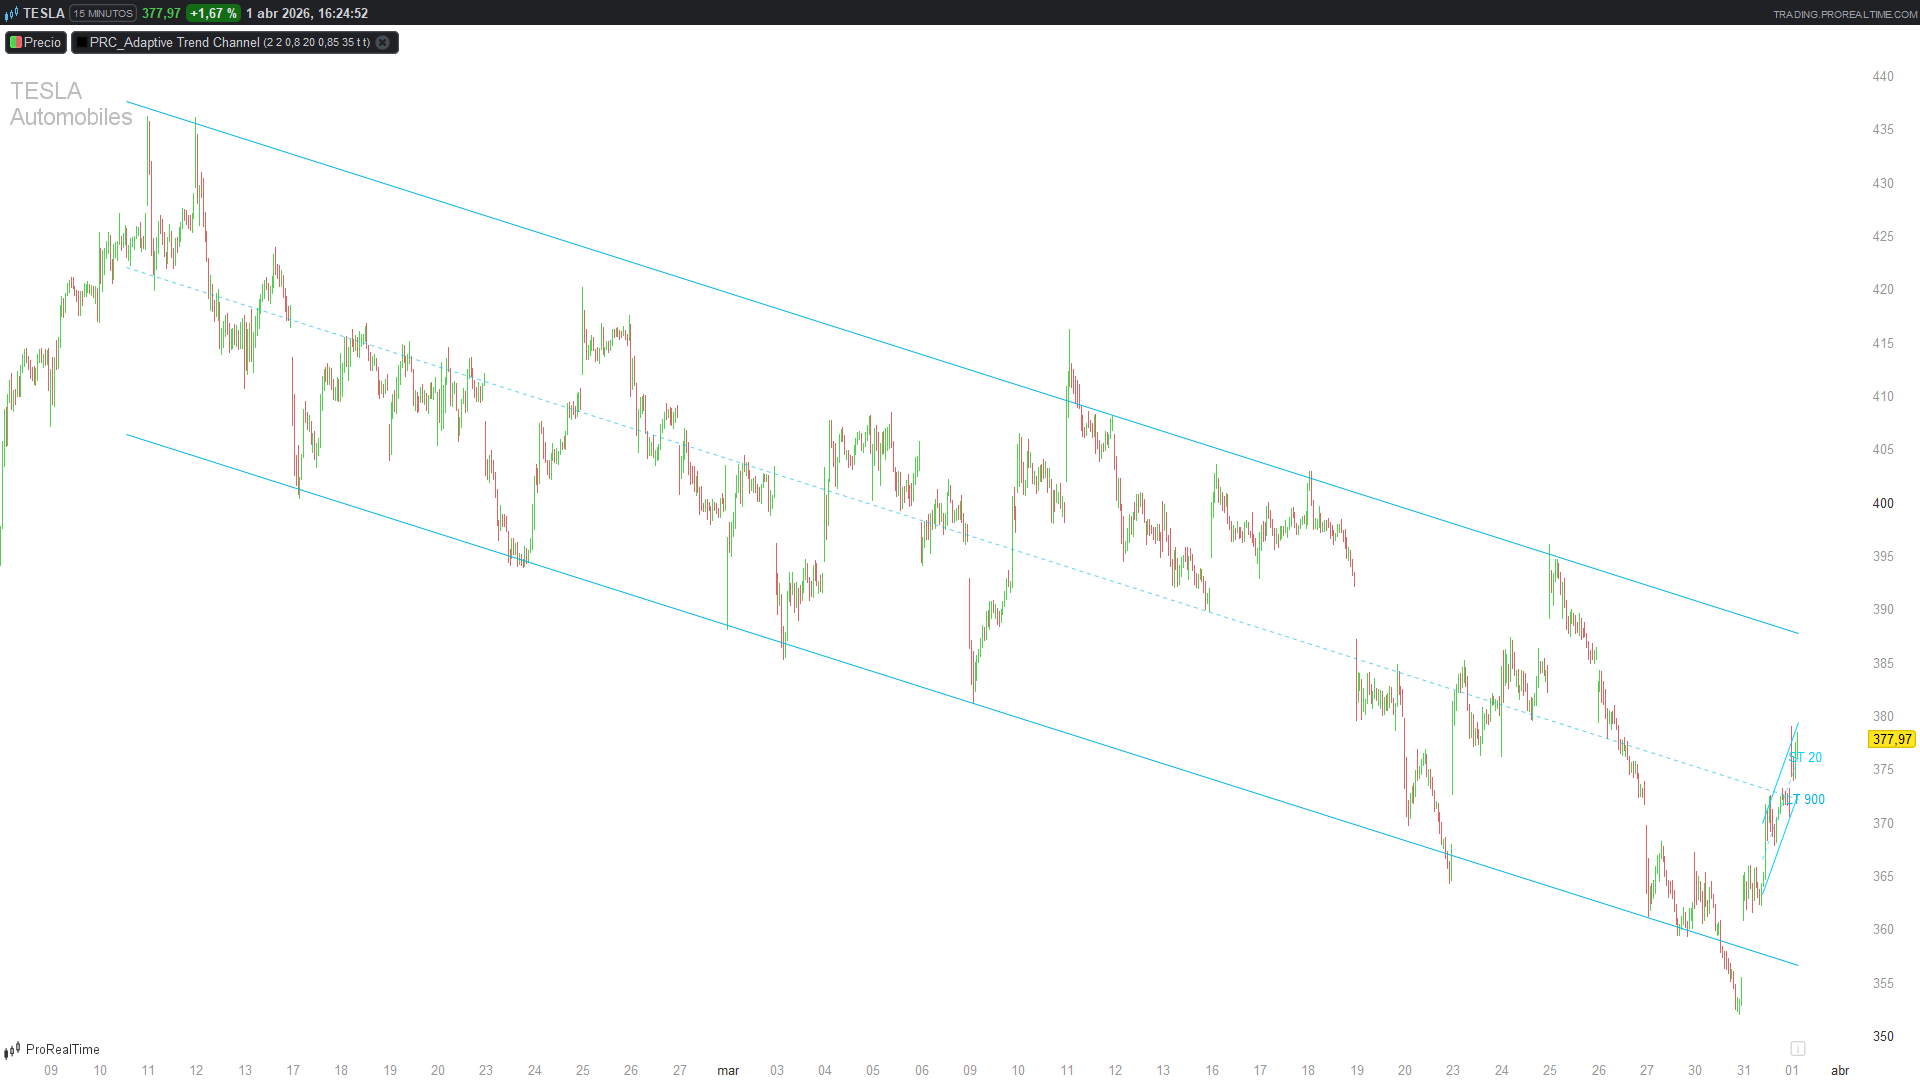
4. Reading the Indicator
The indicator draws three lines per channel:
- Upper band (solid): Regression line + deviation multiplier × standard deviation
- Lower band (solid): Regression line − deviation multiplier × standard deviation
- Midline (dashed): The regression line itself — represents the estimated trend direction
A label at the right edge shows the selected period (e.g., “ST 90” means the short-term channel uses a 90-bar regression).
Color interpretation:
- Blue = Eligible channel. It passed all quality filters — strong linear fit, adequate trend strength, good price containment, and reasonable width.
- Gray = Fallback channel. The best available option, but it did not meet all eligibility criteria. Treat with caution.
5. Practical Applications
- Trend direction: The slope of the midline shows the prevailing trend. Both channels sloping the same way confirms alignment.
- Mean reversion entries: Look for price touching the lower band in an uptrend (or upper band in a downtrend) as potential pullback entry zones.
- Breakout detection: Price closing outside the channel bands may signal a structural break or acceleration.
- Regime assessment: When both channels are eligible (blue), the market has clear structure. When channels turn gray, the market may be transitioning or choppy.
- Multi-timeframe context: A short-term channel inside a long-term channel provides natural support/resistance confluence.
6. Parameters
| Parameter | Default | Description |
|———–|———|————-|
| `devMult` | 2.0 | Display deviation multiplier. Controls channel width on the chart. |
| `selDevMult` | 2.0 | Selection deviation multiplier. Used internally during candidate scoring. |
| `minPearsonR` | 0.80 | Minimum absolute Pearson r for eligibility. Higher = stricter linear fit requirement. |
| `minADXval` | 20 | Minimum ADX for eligibility. Filters out ranging markets. |
| `minContain` | 0.85 | Minimum containment ratio. At least 85% of bars must fall within the channel. |
| `maxWidthPct` | 35 | Maximum channel width as % of price. Prevents excessively wide channels. |
| `showShort` | 1 | Show/hide the short-term channel (1=show, 0=hide). |
| `showLong` | 1 | Show/hide the long-term channel (1=show, 0=hide). |
7. Performance Note
All heavy computation (regression calculation, scoring, selection) runs exclusively on the last bar via islastbarupdate, keeping the indicator responsive even with 22 candidate channels being evaluated simultaneously. The visual output uses drawsegment with defparam drawonlastbaronly = true to prevent line accumulation on lower timeframes.
8. Code
//-------------------------------------------------//
// PRC_Adaptive Trend Channel
// Adapted from PineScript [Julien_Exe]
// version = 0
// 30.03.2026
// Iván González @ www.prorealcode.com
// Sharing ProRealTime knowledge
//-------------------------------------------------//
defparam drawonlastbaronly = true

// === INPUTS ===
devMult = 2.0       // Display Deviation Multiplier
selDevMult = 2.0    // Selection Deviation Multiplier
minPearsonR = 0.80  // Min |Pearson r| for eligibility
minADXval = 20      // Min ADX for eligibility
minContain = 0.85   // Min Containment ratio
maxWidthPct = 35    // Max Width % allowed
showShort = 1       // Show Short-Term Channel (1=yes)
showLong = 1        // Show Long-Term Channel (1=yes)

// === ADX NATIVE ===
myADX = ADX[14]

// === CANDIDATE LENGTHS ===
// Short-Term: 12 candidates (closer to Pine's 20-200 step 10)
once $sLen[0] = 20
once $sLen[1] = 30
once $sLen[2] = 50
once $sLen[3] = 70
once $sLen[4] = 90
once $sLen[5] = 110
once $sLen[6] = 130
once $sLen[7] = 150
once $sLen[8] = 170
once $sLen[9] = 180
once $sLen[10] = 190
once $sLen[11] = 200

// Long-Term: 10 candidates (closer to Pine's 300-1200 step 50)
once $lLen[0] = 300
once $lLen[1] = 400
once $lLen[2] = 500
once $lLen[3] = 600
once $lLen[4] = 700
once $lLen[5] = 800
once $lLen[6] = 900
once $lLen[7] = 1000
once $lLen[8] = 1100
once $lLen[9] = 1200

// ================================================================
// MAIN COMPUTATION (last bar only for performance)
// ================================================================
IF islastbarupdate THEN

   // ============================================================
   // SHORT-TERM CHANNEL
   // ============================================================
   IF showShort THEN
      numS = 12
      FOR c = 0 TO numS - 1 DO
         len = $sLen[c]
         IF barindex >= len THEN
            // --- Linear Regression ---
            sumX = 0
            sumXX = 0
            sumYX = 0
            sumY = 0
            FOR i = 1 TO len DO
               val = close[i - 1]
               sumX = sumX + i
               sumXX = sumXX + i * i
               sumYX = sumYX + i * val
               sumY = sumY + val
            NEXT

            denom = len * sumXX - sumX * sumX
            IF denom <> 0 THEN
               sl = (len * sumYX - sumX * sumY) / denom
            ELSE
               sl = 0
            ENDIF
            av = sumY / len
            ic = av - sl * sumX / len + sl

            // --- Std Deviation + Pearson r ---
            sumDev = 0
            sumDxx = 0
            sumDyy = 0
            sumDyx = 0
            n1 = len - 1
            regMid = ic + sl * n1 * 0.5
            lv = ic
            FOR i = 0 TO n1 DO
               v = close[i]
               dxt = v - av
               dyt = lv - regMid
               diff = v - lv
               lv = lv + sl
               sumDxx = sumDxx + dxt * dxt
               sumDyy = sumDyy + dyt * dyt
               sumDyx = sumDyx + dxt * dyt
               sumDev = sumDev + diff * diff
            NEXT

            df = max(1, len - 2)
            sd = sqrt(sumDev / df)
            div = sumDxx * sumDyy
            IF div > 0 THEN
               pr = sumDyx / sqrt(div)
            ELSE
               pr = 0
            ENDIF
            absR = abs(pr)

            // --- Containment Ratio ---
            ins = 0
            bd = selDevMult * sd
            lv = ic
            FOR i = 0 TO len - 1 DO
               IF abs(close[i] - lv) <= bd THEN
                  ins = ins + 1
               ENDIF
               lv = lv + sl
            NEXT
            cont = ins / len

            // --- Channel Width % ---
            mid = ic
            wp = 0
            IF abs(mid) > 0 THEN
               wp = (2 * selDevMult * sd) / abs(mid) * 100
            ENDIF

            // --- Trend Efficiency ---
            te = 0
            IF sd > 0 THEN
               te = abs(sl) / sd
            ENDIF

            // --- Robust Composite Score ---
            teScore = te / (te + 1.0)
            rScore = min(max(absR, 0), 1)
            adxScore = min(max((myADX - 15) / 25, 0), 1)
            wScore = 1 - min(max(wp, 0), 40) / 40
            cntScore = min(max(cont, 0), 1)
            score = 100 * (0.40 * teScore + 0.25 * rScore + 0.10 * wScore + 0.07 * cntScore + 0.03 * adxScore)

            // --- Eligibility ---
            elig = 0
            IF absR >= minPearsonR AND myADX >= minADXval AND cont >= minContain AND wp <= maxWidthPct THEN
               elig = 1
            ENDIF

            $sSd[c] = sd
            $sSl[c] = sl
            $sIc[c] = ic
            $sScore[c] = score
            $sElig[c] = elig
         ELSE
            $sScore[c] = 0
            $sElig[c] = 0
         ENDIF
      NEXT

      // --- Stability + Final Score ---
      FOR c = 0 TO numS - 1 DO
         curr = $sScore[c]
         stab = 0
         cnt = 0
         IF c > 0 THEN
            IF curr > 0 THEN
               prev = $sScore[c - 1]
               stab = stab + max(0, 1 - abs(curr - prev) / max(curr, 0.0001))
               cnt = cnt + 1
            ENDIF
         ENDIF
         IF c < numS - 1 THEN
            IF curr > 0 THEN
               nxt = $sScore[c + 1]
               stab = stab + max(0, 1 - abs(curr - nxt) / max(curr, 0.0001))
               cnt = cnt + 1
            ENDIF
         ENDIF
         IF cnt > 0 THEN
            stab = stab / cnt
         ENDIF
         $sFinal[c] = curr + 15 * stab
      NEXT

      // --- Select Best Short ---
      bestES = -1
      bestEIS = -1
      bestAS = -1
      bestAIS = -1
      FOR c = 0 TO numS - 1 DO
         IF $sFinal[c] > bestAS THEN
            bestAS = $sFinal[c]
            bestAIS = c
         ENDIF
         IF $sElig[c] = 1 THEN
            IF $sFinal[c] > bestES THEN
               bestES = $sFinal[c]
               bestEIS = c
            ENDIF
         ENDIF
      NEXT

      idxS = -1
      eligFlagS = 0
      IF bestEIS >= 0 THEN
         idxS = bestEIS
         eligFlagS = 1
      ELSIF bestAIS >= 0 THEN
         idxS = bestAIS
      ENDIF

      // --- Draw Short Channel ---
      IF idxS >= 0 THEN
         selLenS = $sLen[idxS]
         selSlopeS = $sSl[idxS]
         selIcS = $sIc[idxS]
         selSdS = $sSd[idxS]

         sBarStart = barindex - selLenS + 1
         sStartP = selIcS + selSlopeS * (selLenS - 1)
         sEndP = selIcS
         sBand = devMult * selSdS

         IF eligFlagS THEN
            rS = 0
            gS = 210
            bS = 255
         ELSE
            rS = 150
            gS = 150
            bS = 150
         ENDIF

         // Midline (dashed)
         drawsegment(sBarStart, sStartP, barindex, sEndP) coloured(rS, gS, bS, 140) style(dottedline, 1)
         // Upper band
         drawsegment(sBarStart, sStartP + sBand, barindex, sEndP + sBand) coloured(rS, gS, bS) style(line, 1)
         // Lower band
         drawsegment(sBarStart, sStartP - sBand, barindex, sEndP - sBand) coloured(rS, gS, bS) style(line, 1)
         // Label
         drawtext("ST #selLenS#", barindex + 5, sEndP) coloured(rS, gS, bS)
      ENDIF
   ENDIF

   // ============================================================
   // LONG-TERM CHANNEL (relaxed thresholds)
   // ============================================================
   IF showLong THEN
      numL = 10
      // Relaxed params for long-term
      lSelDev = selDevMult + 0.10
      lMinPearson = minPearsonR
      lMinADX = max(0, minADXval - 2)
      lMinContain = max(0, minContain - 0.03)
      lMaxWidth = maxWidthPct + 10
      lWidthCap = 55
      lHalfSat = 1.35

      FOR c = 0 TO numL - 1 DO
         len = $lLen[c]
         IF barindex >= len THEN
            // --- Linear Regression ---
            sumX = 0
            sumXX = 0
            sumYX = 0
            sumY = 0
            FOR i = 1 TO len DO
               val = close[i - 1]
               sumX = sumX + i
               sumXX = sumXX + i * i
               sumYX = sumYX + i * val
               sumY = sumY + val
            NEXT

            denom = len * sumXX - sumX * sumX
            IF denom <> 0 THEN
               sl = (len * sumYX - sumX * sumY) / denom
            ELSE
               sl = 0
            ENDIF
            av = sumY / len
            ic = av - sl * sumX / len + sl

            // --- Std Deviation + Pearson r ---
            sumDev = 0
            sumDxx = 0
            sumDyy = 0
            sumDyx = 0
            n1 = len - 1
            regMid = ic + sl * n1 * 0.5
            lv = ic
            FOR i = 0 TO n1 DO
               v = close[i]
               dxt = v - av
               dyt = lv - regMid
               diff = v - lv
               lv = lv + sl
               sumDxx = sumDxx + dxt * dxt
               sumDyy = sumDyy + dyt * dyt
               sumDyx = sumDyx + dxt * dyt
               sumDev = sumDev + diff * diff
            NEXT

            df = max(1, len - 2)
            sd = sqrt(sumDev / df)
            div = sumDxx * sumDyy
            IF div > 0 THEN
               pr = sumDyx / sqrt(div)
            ELSE
               pr = 0
            ENDIF
            absR = abs(pr)

            // --- Containment ---
            ins = 0
            bd = lSelDev * sd
            lv = ic
            FOR i = 0 TO len - 1 DO
               IF abs(close[i] - lv) <= bd THEN
                  ins = ins + 1
               ENDIF
               lv = lv + sl
            NEXT
            cont = ins / len

            // --- Width % ---
            mid = ic
            wp = 0
            IF abs(mid) > 0 THEN
               wp = (2 * lSelDev * sd) / abs(mid) * 100
            ENDIF

            // --- Trend Efficiency ---
            te = 0
            IF sd > 0 THEN
               te = abs(sl) / sd
            ENDIF

            // --- Score (with relaxed half-sat) ---
            teScore = te / (te + lHalfSat)
            rScore = min(max(absR, 0), 1)
            adxScore = min(max((myADX - 15) / 25, 0), 1)
            wScore = 1 - min(max(wp, 0), lWidthCap) / lWidthCap
            cntScore = min(max(cont, 0), 1)
            score = 100 * (0.40 * teScore + 0.25 * rScore + 0.10 * wScore + 0.07 * cntScore + 0.03 * adxScore)

            // --- Eligibility (relaxed) ---
            elig = 0
            IF absR >= lMinPearson AND myADX >= lMinADX AND cont >= lMinContain AND wp <= lMaxWidth THEN
               elig = 1
            ENDIF

            $lSd[c] = sd
            $lSl[c] = sl
            $lIc[c] = ic
            $lScore[c] = score
            $lElig[c] = elig
         ELSE
            $lScore[c] = 0
            $lElig[c] = 0
         ENDIF
      NEXT

      // --- Stability + Final Score ---
      FOR c = 0 TO numL - 1 DO
         curr = $lScore[c]
         stab = 0
         cnt = 0
         IF c > 0 THEN
            IF curr > 0 THEN
               prev = $lScore[c - 1]
               stab = stab + max(0, 1 - abs(curr - prev) / max(curr, 0.0001))
               cnt = cnt + 1
            ENDIF
         ENDIF
         IF c < numL - 1 THEN
            IF curr > 0 THEN
               nxt = $lScore[c + 1]
               stab = stab + max(0, 1 - abs(curr - nxt) / max(curr, 0.0001))
               cnt = cnt + 1
            ENDIF
         ENDIF
         IF cnt > 0 THEN
            stab = stab / cnt
         ENDIF
         $lFinal[c] = curr + 15 * stab
      NEXT

      // --- Select Best Long ---
      bestEL = -1
      bestEIL = -1
      bestAL = -1
      bestAIL = -1
      FOR c = 0 TO numL - 1 DO
         IF $lFinal[c] > bestAL THEN
            bestAL = $lFinal[c]
            bestAIL = c
         ENDIF
         IF $lElig[c] = 1 THEN
            IF $lFinal[c] > bestEL THEN
               bestEL = $lFinal[c]
               bestEIL = c
            ENDIF
         ENDIF
      NEXT

      idxL = -1
      eligFlagL = 0
      IF bestEIL >= 0 THEN
         idxL = bestEIL
         eligFlagL = 1
      ELSIF bestAIL >= 0 THEN
         idxL = bestAIL
      ENDIF

      // --- Draw Long Channel ---
      IF idxL >= 0 THEN
         selLenL = $lLen[idxL]
         selSlopeL = $lSl[idxL]
         selIcL = $lIc[idxL]
         selSdL = $lSd[idxL]

         lBarStart = barindex - selLenL + 1
         lStartP = selIcL + selSlopeL * (selLenL - 1)
         lEndP = selIcL
         lBand = devMult * selSdL

         IF eligFlagL THEN
            rL = 0
            gL = 180
            bL = 230
         ELSE
            rL = 130
            gL = 130
            bL = 130
         ENDIF

         // Midline (dashed)
         drawsegment(lBarStart, lStartP, barindex, lEndP) coloured(rL, gL, bL, 160) style(dottedline, 1)
         // Upper band
         drawsegment(lBarStart, lStartP + lBand, barindex, lEndP + lBand) coloured(rL, gL, bL) style(line, 1)
         // Lower band
         drawsegment(lBarStart, lStartP - lBand, barindex, lEndP - lBand) coloured(rL, gL, bL) style(line, 1)
         // Label
         drawtext("LT #selLenL#", barindex + 5, lEndP) coloured(rL, gL, bL)
      ENDIF
   ENDIF

ENDIF

RETURN
