

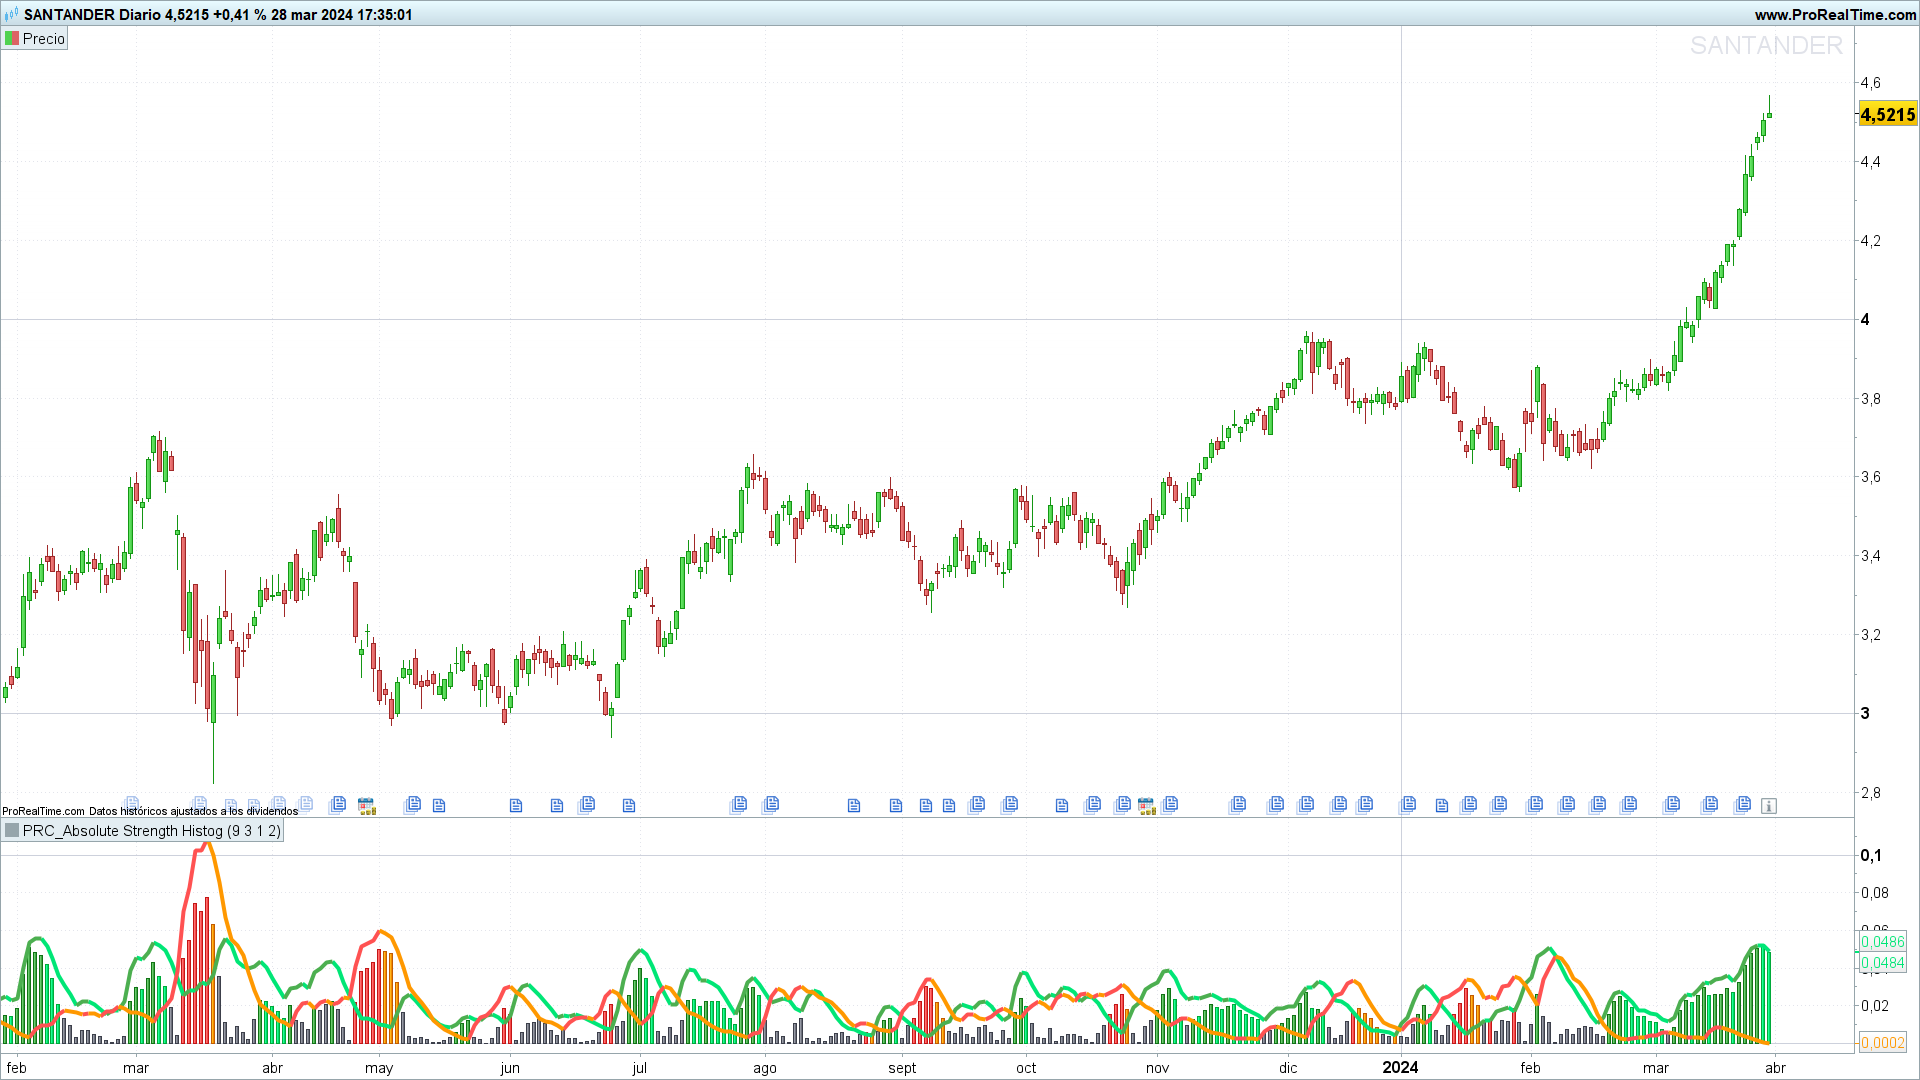
Absolute Strength Histogram Indicator
Introduction
The Absolute Strength Histogram indicator is not only noted for its accuracy but also for its ability to provide a clear perspective on the buying and selling dynamics within the financial markets. By measuring the strength of bulls (buyers) against bears (sellers), the Absolute Strength Histogram aids in identifying potential market trend changes, thus providing a solid foundation for informed trading decisions.
Concept and Calculation
The concept behind the Absolute Strength Histogram is based on its unique approach to analyzing market strength. Unlike other indicators that may focus on a single aspect of the market, this indicator utilizes a combination of methods to assess both the strength of buyers and sellers. Key input variables include:
- Length: Evaluation period.
- Smooth: Smoothing period of the results.
- Source: Price data to analyze, typically the adjusted close price (customclose).
- Mode: Selection between RSI, Stochastic, or ADX for calculation.
- Moving Average Type: Determines the type of moving average applied for smoothing, with WMA (weighted moving average) as the default.
The calculation methodology varies slightly depending on the selected mode, adjusting to capture the essence of each approach. For example, in RSI mode, it focuses on the magnitude of recent price changes to determine market buyers’ and sellers’ strength.
The smoothing process applied to both bull and bear values helps to filter market noise and highlight underlying trends, facilitating the interpretation of market strength. This smoothing process culminates in constructing the histogram that reflects the absolute difference between these two forces.
Indicator Interpretation
Effective interpretation of the Absolute Strength Histogram is achieved by observing the histogram and the color changes within it. An ascending histogram indicates increased buyers’ strength, whereas a descending histogram signals stronger seller influence. Color changes within the histogram serve as early indicators of possible market direction changes.
When the histogram’s color changes in favor of bulls, it could be considered a buying signal, while a change favoring bears could be interpreted as a selling signal. These signals, especially when confirmed by other indicators, can provide opportune moments to enter or exit the market.
Practical Applications
The Absolute Strength Histogram can be used to:
- Identify the onset of new trends.
- Confirm buying or selling signals provided by other indicators.
- Determine exit points by observing color changes in the histogram indicating a market strength shift.
This indicator well suits various trading strategies, from scalping to position trading, offering a versatile tool to complement their technical analysis.
Advantages and Limitations
One of the main advantages of the Absolute Strength Histogram is its ability to simplify the analysis of market strength into a visually intuitive format.
However, as with any analysis tool, it’s crucial to use the Absolute Strength Histogram in conjunction with other forms of analysis to confirm signals and avoid false positives. Exclusive reliance on a single indicator can lead to misguided trading decisions.
Code in ProBuilder
The following is the simplified code for implementing the Absolute Strength Histogram on the ProRealTime:
//PRC_ABSOLUTE STRENGTH HISTOGRAM
//version = 0
//01.04.24
//Iván González @ www.prorealcode.com
//Sharing ProRealTime knowledge
///////////////////////////////////////////////////////
//-----Inputs----------------------------------------//
length = 9 //Period of evaluation
smooth = 3 //Period of smoothing
src = customclose
Mode = 1 //RSI = 1 / Stochastic = 2 / ADX = 3
Matype = 2 //Moving average Type - WMA by default
//---------------------------------------------------//
//-----Bull and Bear Trends calculation-------------//
if mode = 2 then //Stochastic
Bulls = src - lowest[length](src)
Bears = highest[Length](src)-src
elsif mode = 3 then //ADX
Bulls = 0.5*(abs(high-high[1])+(high-high[1]))
Bears = 0.5*(abs(low[1]-low)+(low[1]-low))
else //RSI
Bulls = 0.5*(abs(src-src[1])+(src-src[1]))
Bears = 0.5*(abs(src-src[1])-(src-src[1]))
endif

avgbulls = average[length,maType](Bulls)
avgbears = average[length,maType](Bears)

SmthBulls = average[Smooth,maType](avgbulls)
SmthBears = average[Smooth,maType](avgbears)

difference = abs(SmthBulls-SmthBears)
//---------------------------------------------------//
//----Bull trend color------------------------------//
if SmthBulls < SmthBulls[1] then
rbull=0
gbull=230
bbull=118
else
rbull=76
gbull=175
bbull=80
endif
//----Bear trend color------------------------------//
if SmthBears < SmthBears[1] then
rbear=255
gbear=152
bbear=0
else
rbear=255
gbear=82
bbear=82
endif
//----Difference color------------------------------//
if difference > SmthBulls then
if SmthBears < SmthBears[1] then
r=255
g=152
b=0
else
r=255
g=82
b=82
endif
elsif difference > SmthBears then
if SmthBulls < SmthBulls[1] then
r=0
g=230
b=118
else
r=76
g=175
b=80
endif
else
r=120
g=123
b=134
endif
//---------------------------------------------------//
return difference as "Strength" coloured(r,g,b)style(histogram,1), SmthBulls as "Bull Trend" coloured(rbull,gbull,bbull)style(line,4), SmthBears as "Bear Trend" coloured(rbear,gbear,bbear)style(line,4)
