

A Kind of non-repainting COG
June 25, 2020, 9:44 AM
Indicators
0 Comments
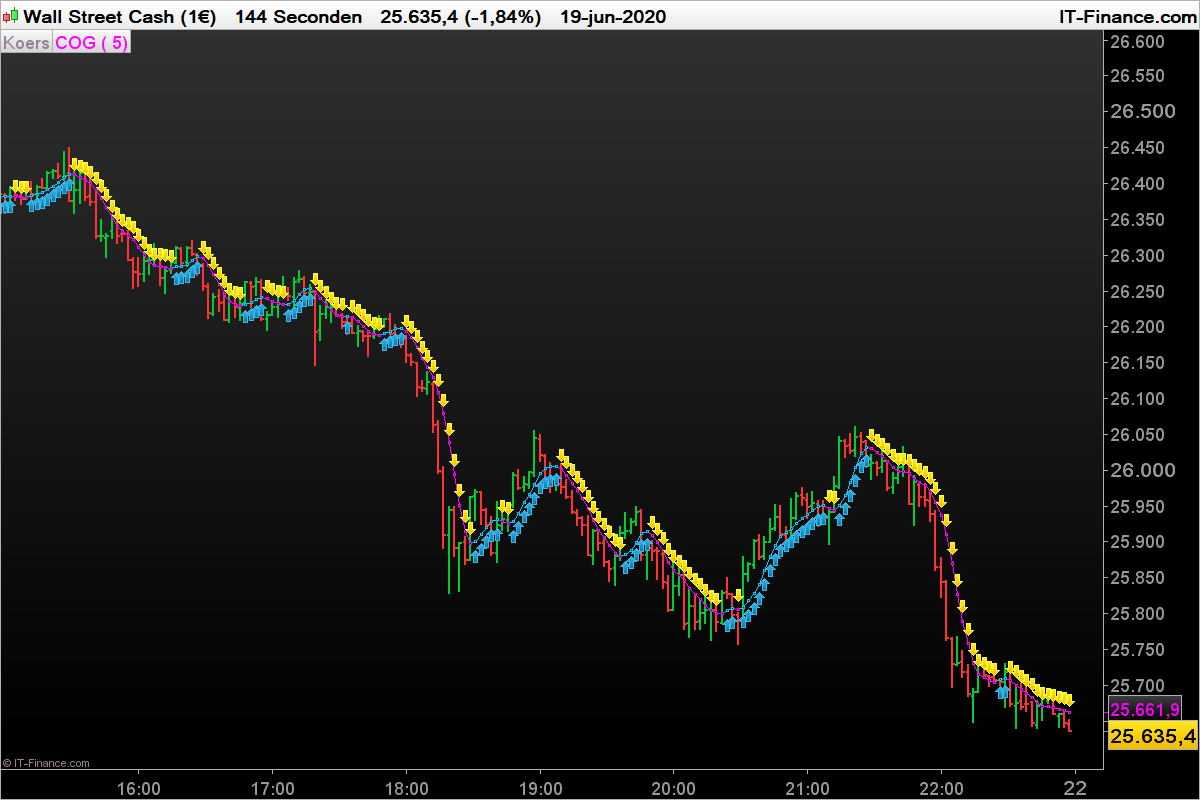
I have written this kind of indicator for the first time in july 2015, first as an oscillator, later as an indicator on the graph. Its the basic of my avatar.
It uses a triangular moving average of periods 2 applied on the average of the last “n” median price. If the slope is ascending, it plots blue arrows and yellow arrows when the slope of the TMA is descending.
// settings
n = 20
// ---

HL=(high+low)/2
Sum=(summation[n](HL))/n
cog=TriangularAverage[2](sum)

if cog > cog[1] then
DRAWARROWUP(barindex, cog-0.25*AverageTrueRange[14](close))coloured(0,125,175,255)
elsif cog < cog[1] then
DRAWARROWDOWN(barindex, cog+0.25*AverageTrueRange[14](close))coloured(255,205,0,255)
endif
return cog
Download
Filename:
kind-of-non-repainting-COG.itf
Downloads:
382
Master
This author is like an anonymous function, present but not directly identifiable. More details on this code architect as soon as they exit 'incognito' mode.
Author’s Profile
Loading...