

A Backtest as an indicator
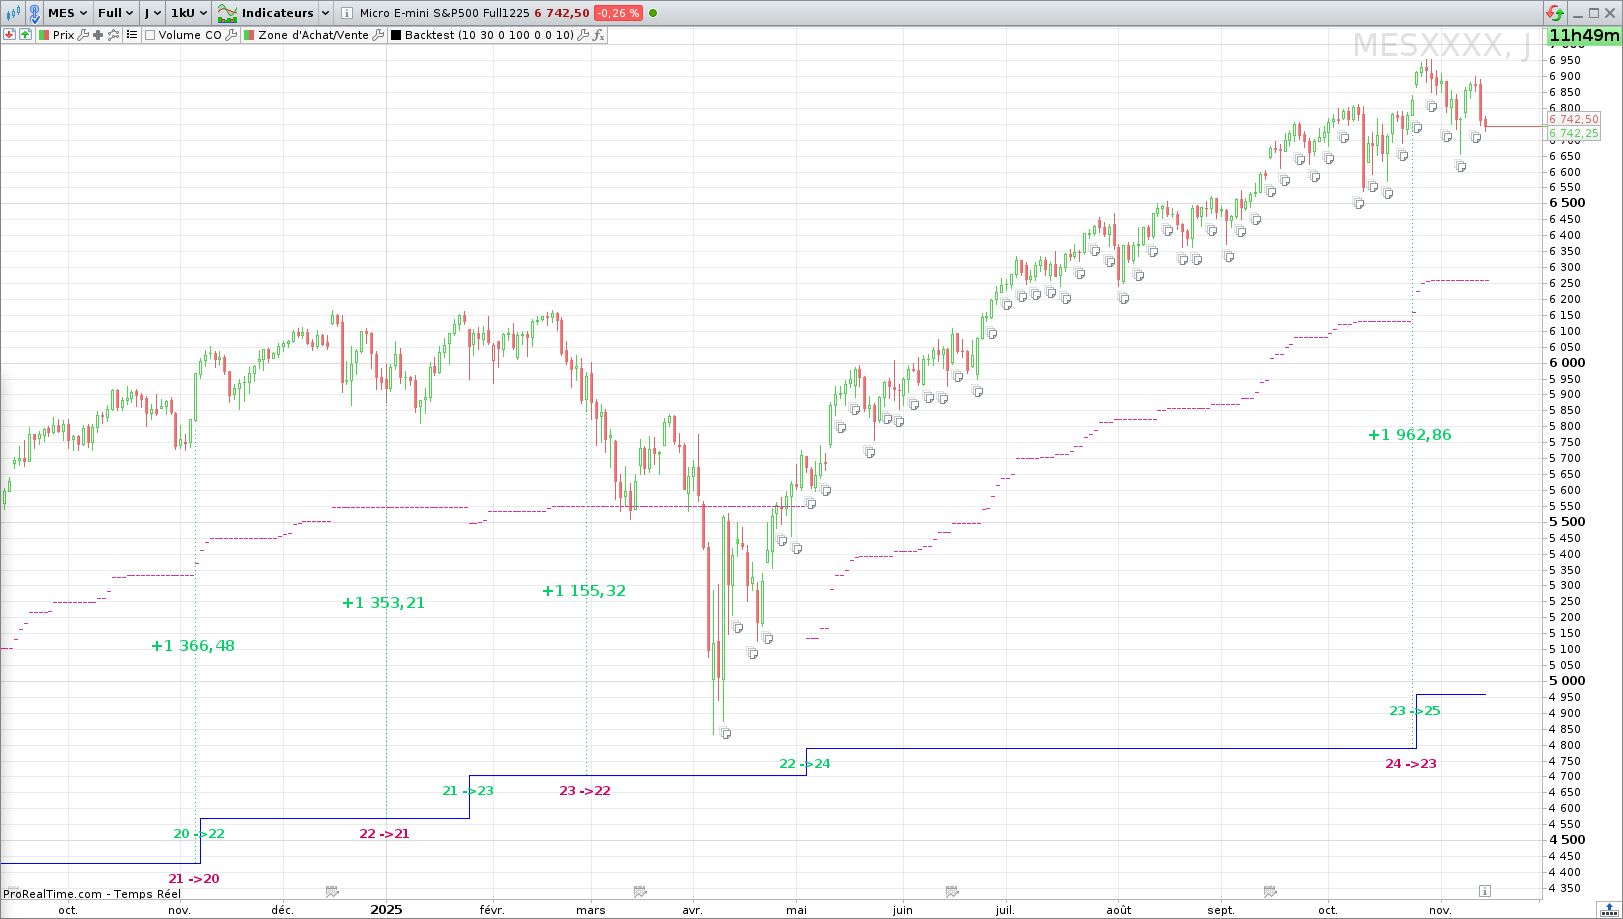
I created an indicator to allow me to simulate a backtest and display the results straigth on the graph.
Works with any strategy using only MKT orders.
Feel free to try out.
1) What this “homemade backtest” does
This indicator turns any signal you write into a lightweight, visual backtest that runs directly on your chart. You provide orders via the variable TradingSignal (positive to buy, negative to sell), and the engine handles entries, scaling, unit price, realized/unrealized P&L, fixed/trailed stops, and profit targets. It lets you iterate quickly on ideas without converting everything into a full system.
2) How the engine works (in plain English)
-
You send market orders through
TradingSignal. The order is executed at the opening price of the next bar, adjusted bySpreadin ticks. -
Positions accumulate: the engine sums all signals into
Position. It supports scale-in/scale-out (e.g., +2 then −1). -
Cost basis tracking:
UnitPriceis updated whenever size changes; realized P&L (PL) is computed on reductions/reversals. -
Exit levels:
-
TargetLevel= unit price ±TargetPct -
StopLevel= unit price ∓StopPct -
StopTrailingfollows price usingStopTrailingPctand resets on unit-price change.
-
-
Visualization: colored segments/text show unit price, local P&L at each trade, and active stop/target lines.
-
Unrealized P&L updates on every bar from
UnitPriceto the current closing price (spread-aware).
3) Parameters you can tune
Declared once at the top (they appear in the indicator’s settings):
-
Spread(ticks): Simulates execution friction. Use the instrument’s typical spread in ticks. Set to0to ignore. -
TargetPct(%): Take-profit distance fromUnitPrice. Set to0to hide/disable targets. -
StopPct(%): Fixed stop distance fromUnitPrice. Set to0to hide/disable fixed stops. -
StopTrailingPct(%): Trailing stop distance from the trailing reference. Set to0to hide/disable trailing stops.
You can change these interactively to see how your strategy behaves with different trade management settings.
4) How to set it up in ProRealTime (step-by-step)
-
Create a new indicator in ProBuilder and paste the full code you were given.
-
Leave everything above the “write your code below” banner untouched. That block is the engine.
-
In the lower block, either keep the sample MA crossover or replace it with your own logic (see next section).
-
If you don’t have a custom price series, define
CustomClose = Closebefore your averages, or replaceCustomClosewithClose. -
Apply the indicator to your chart. You’ll see unit price lines, stop/target levels, and trade P&L callouts appear when signals occur.
-
Tune
Spread,TargetPct,StopPct, andStopTrailingPctfrom the indicator’s parameters to stress-test your idea.
5) Writing your own TradingSignal (the only line you should change)
-
You must output the order quantity you want on that bar:
-
Positive value = buy (e.g.,
+1,+2), -
Negative value = sell/short (e.g.,
-1,-3).
-
-
Orders are market and are executed on the next bar’s open (with spread applied and sign-aware).
-
You can scale in/out by sending additional positive/negative quantities on later bars.
-
Do not overwrite engine variables declared above (e.g., don’t write
UnitPrice = ...). The only variable you’re allowed to drive isTradingSignal. Reading them is fine (e.g., usePL,Position,UnitPricein conditions).
Example (provided in the code):
-
P1 = 20,P2 = 50,AvType = 0(simple average). -
Av1 = Average[P1,AvType](CustomClose)andAv2 = Average[P2,AvType](CustomClose). -
TradingSignal = (Av1 CROSSES OVER Av2) * 2 - (Av1 CROSSES UNDER Av2) * 1-
Buys 2 when fast crosses above slow, sells 1 when it crosses below (scale-out).
-
6) Reading the on-chart visuals
-
Unit price (blue): horizontal line segments marking your current cost basis. A vertical blue “jump” appears when size changes.
-
Target (green): your take-profit line from
UnitPrice. -
Fixed stop (magenta-red dotted): your hard stop from
UnitPrice. -
Trailing stop (purple-pink dotted): follows highs in long trades (or lows in shorts) and resets when
UnitPricechanges. -
Trade callouts: when an order fires, you’ll see
PrevPos -> Positionand a dotted line to the fill level.-
Green callout = realized profit on that transaction, red = realized loss.
-
-
Unrealized P&L: tracked internally as
UnrealizedPLfor the open position.
7) Optional outputs with RETURN
By default the script returns nothing to keep charts clean. You can enable the optional RETURN block at the end to display:
-
TradingSignal(histogram): see when/where orders are sent. -
Position(histogram): visualize net exposure and scaling. -
UnrealizedPL: running P&L of the open trade.
To enable it, comment out RETURN and uncomment the provided RETURN lines.
8) Tips, limitations & troubleshooting
-
Execution model: orders are next-bar-open; there’s no intra-bar fill logic. Large gaps may jump straight to target/stop without intermediate prints.
-
Spread only: slippage isn’t modeled beyond
Spread. If you need extra friction, increaseSpread. -
Disable lines: set any of
TargetPct,StopPct, orStopTrailingPctto0. -
CustomClose not defined? Add
CustomClose = Closein your “write code below” section before using it in calculations. -
Position sizing: use integers in
TradingSignalto control scale-in/out. The engine tracks average price correctly for partial exits. -
Don’t touch engine variables: changing
UnitPrice,PL,Position, etc., will break accounting. Only write toTradingSignal. -
Color meanings:
-
Green segments/text = profitable transaction.
-
Red segments/text = losing transaction.
-
Blue = unit price.
-
Dotted lines = stops/trailing and trade link.
-
9) Code placement reminder
Only add or modify logic below the banner:
There you can:
-
Declare your own settings (e.g., periods, thresholds).
-
Compute indicators on
Closeor your ownCustomClose. -
Output only
TradingSignal.
// Backtest Parameters - To add as indicator Variables

ONCE Spread = 0
ONCE TargetPct = 7.5
ONCE StopPct = 3
ONCE StopTrailingPct = 10

// ------------------------------------------------------------------------------------------------------------------------------------------
// ----------------------------------------------Avoid changing the code Below----------------------------------------------
// ------------------------------------------------------------------------------------------------------------------------------------------

// Position computer
ONCE Position = 0
ONCE UnitPrice = 0
ONCE PL = 0

Position = Position + TradingSignal

LastOrderQty = TradingSignal
LastOrderLevel = (Open + Spread * TICKSIZE) * (TradingSignal > 0) + (Open - Spread * TICKSIZE) * (TradingSignal < 0)

// Multiplying 2 numbers and checking if the result is positive allows to check if both numbers are of the same sign and both strictly non-zero
IF Position[1] * LastOrderQty > 0 THEN
// this case is the case of position increase : Only Unit Price changes
UnitPrice = ( ABS(Position[1]) * UnitPrice + ABS(LastOrderQty) * LastOrderLevel)  / ABS(Position[1] + LastOrderQty )
ELSIF Position CROSSES OVER 0 OR Position CROSSES UNDER 0 THEN
// this case is the case of position reversal : PL has to be computed and Unit Price changes
PL = ( LastOrderLevel - UnitPrice ) * Position[1] + PL
UnitPrice = LastOrderLevel
ELSIF Position[1] * LastOrderQty < 0 THEN
// this case is the case of position decrease : only PL has to be computed
PL = - ( LastOrderLevel - UnitPrice ) * LastOrderQty + PL
ELSIF Position[1] = 0 THEN
// this case is the case of new position : Only Unit Price changes
UnitPrice = LastOrderLevel
ENDIF

IF UnitPrice <> UnitPrice[1] THEN
StopTrailingReference = UnitPrice
ENDIF

IF Position > 0 THEN
StopLevel = UnitPrice * ( 1 - StopPct / 100 )
TargetLevel = UnitPrice * ( 1 + TargetPct  / 100 )
StopTrailingReference = MAX(StopTrailingReference, High )
StopTrailing = StopTrailingReference * ( 1 - StopTrailingPct / 100 )
ELSIF Position < 0 THEN
StopLevel = UnitPrice * ( 1 + StopPct / 100 )
TargetLevel = UnitPrice * ( 1 - TargetPct / 100 )
StopTrailingReference = MIN(StopTrailingReference, Low )
StopTrailing = StopTrailingReference * ( 1 + StopTrailingPct / 100 )
ELSE
StopLevel = 0
TargetLevel = 0
StopTrailing = 0
ENDIF

IF Position <> 0 THEN
IF StopPct <> 0 THEN
DRAWSEGMENT(barindex + 1, StopLevel, barindex, StopLevel) COLOURED(210,0,110) STYLE (DOTTEDLINE3)
ENDIF
IF TargetPct <> 0 THEN
DRAWSEGMENT(barindex + 1, TargetLevel, barindex, TargetLevel) COLOURED(0,210,110)
ENDIF
IF StopTrailingPct <> 0 THEN
DRAWSEGMENT(barindex + 1, StopTrailing, barindex, StopTrailing) COLOURED(210,50,160) STYLE (DOTTEDLINE3)
ENDIF
ENDIF
// Drawing UnitPrice, Chg. pos., Target, Stops, and Realized Profit and Loss on the graph
IF UnitPrice[1] <> 0 THEN
DRAWSEGMENT(barindex, UnitPrice[1], barindex - 1, UnitPrice[1]) COLOURED("Blue")
IF UnitPrice[1] <> UnitPrice AND UnitPrice<> 0 THEN
DRAWSEGMENT(barindex, UnitPrice, barindex, UnitPrice[1]) COLOURED("Blue")
ENDIF
ENDIF

PrevPos = Position[1]
LocalPL = ROUND( PL - PL[1], 2 )
IF TradingSignal <> 0 THEN
IF TradingSignal > 0 THEN
DRAWTEXT("#PrevPos#->#Position#", barindex, UnitPrice * 0.99, Dialog, Bold, 12) COLOURED(0,210,100)
ELSIF TradingSignal < 0 THEN
DRAWTEXT("#PrevPos#->#Position#", barindex, UnitPrice * 0.99, Dialog, Bold, 12) COLOURED(210,0,100)
ENDIF
IF LocalPL > 0 THEN
DRAWSEGMENT(barindex, UnitPrice, barindex, LastOrderLevel) COLOURED(0,210,100) STYLE (DOTTEDLINE4)
DRAWTEXT("+#LocalPL#", barindex, ( UnitPrice + LastOrderLevel ) / 2, Dialog, Bold, 15) COLOURED(0,210,100)
ELSIF LocalPL < 0 THEN
DRAWSEGMENT(barindex, UnitPrice, barindex, LastOrderLevel) COLOURED(210,0,100) STYLE (DOTTEDLINE4)
DRAWTEXT("#LocalPL#", barindex, ( UnitPrice + LastOrderLevel ) / 2, Dialog, Bold, 15) COLOURED(210,0,100)
ENDIF
ENDIF

ClosingPrice = (Close + Spread * TICKSIZE) * (Position < 0) + (Close - Spread * TICKSIZE) * (Position > 0)
UnrealizedPL = PL + ( ClosingPrice - UnitPrice ) * Position

// --------------------------------------------------------------------------------------------------------------------------------------------------------------
// -------------------------------------------Avoid changing the code above---------------------------------------------------------------------
// -------------------------------------------------write your code below-----------------------------------------------------------------------------
// -Be careful not writing in variable used above unless it is TradingSignal ( "UnitPrice = MyVar * 2" is not OK) -
// --------------------Feel free to read any variable used above ("myVar = PL * UnitPrice" is OK) ---------------------------
// --------------------------------------------------------------------------------------------------------------------------------------------------------------

// Just a sample code to show how this homemade backtest work. Feel free to remove anything below comments might be helpful to keep tough.
ONCE P1 = 20
ONCE P2 = 50
ONCE AvType = 0

Av1 = Average[P1,AvType](CustomClose)
Av2 = Average[P2,AvType](CustomClose)

// The goal is having this Variable "TradingSignal" equal to the Market order to send.
// The market order will be executed on the openning price of the following candle.
// In this case we buy 2 when Av1 crosses over Av2 and we sell 1 when Av1 crosses under Av2
TradingSignal = ( Av1 CROSSES OVER Av2 ) * 2 - ( Av1 CROSSES UNDER Av2 ) * 1

// I choosed to return nothing because I could not find a way to display all the results in a clean way for every instruments, but feel free to use the commented RETURN to have some interesting outputs.
RETURN
//RETURN TradingSignal STYLE (HISTOGRAM) COLOURED(( TradingSignal < 0 ) * 210,( TradingSignal > 0 ) * 210,100) AS "Signal", Position STYLE (HISTOGRAM) COLOURED(( Position < 0 ) * 210,( Position > 0 ) * 210,100,50) AS "Position", UnrealizedPL as "UnrealizedPL" COLOURED((UnrealizedPL<UnrealizedPL[1])*250,(UnrealizedPL<>UnrealizedPL[1])*125,(UnrealizedPL>UnrealizedPL[1])*250)