

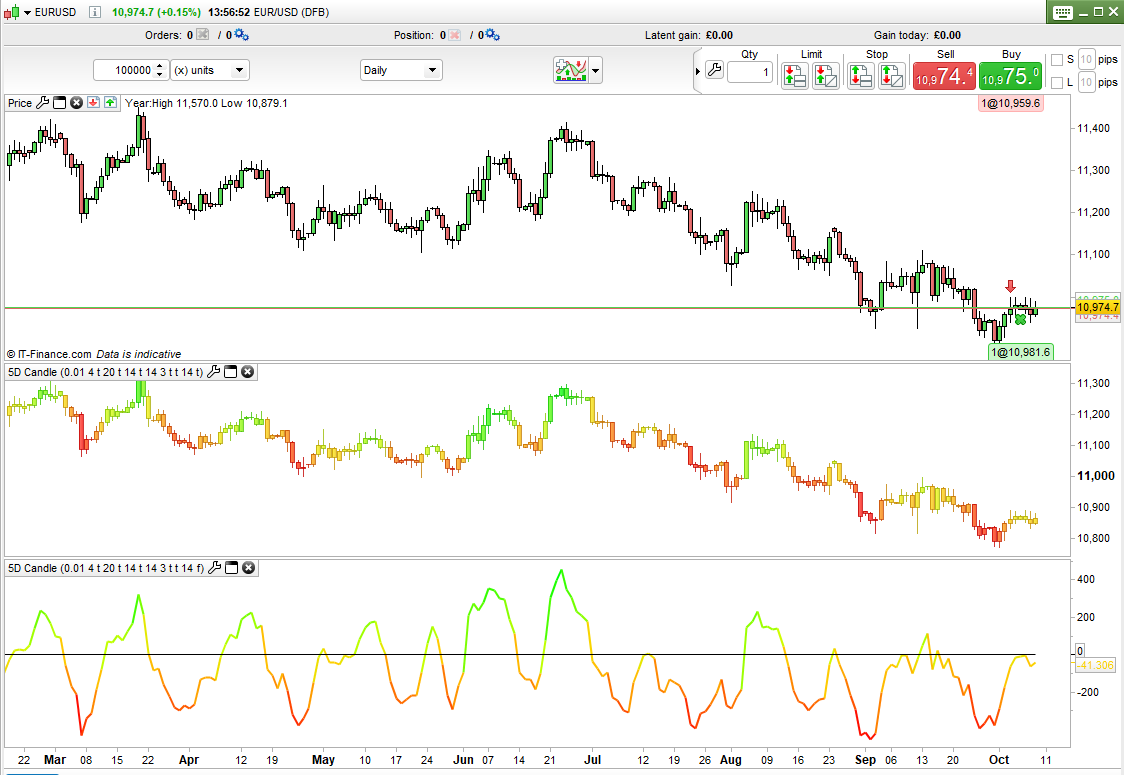
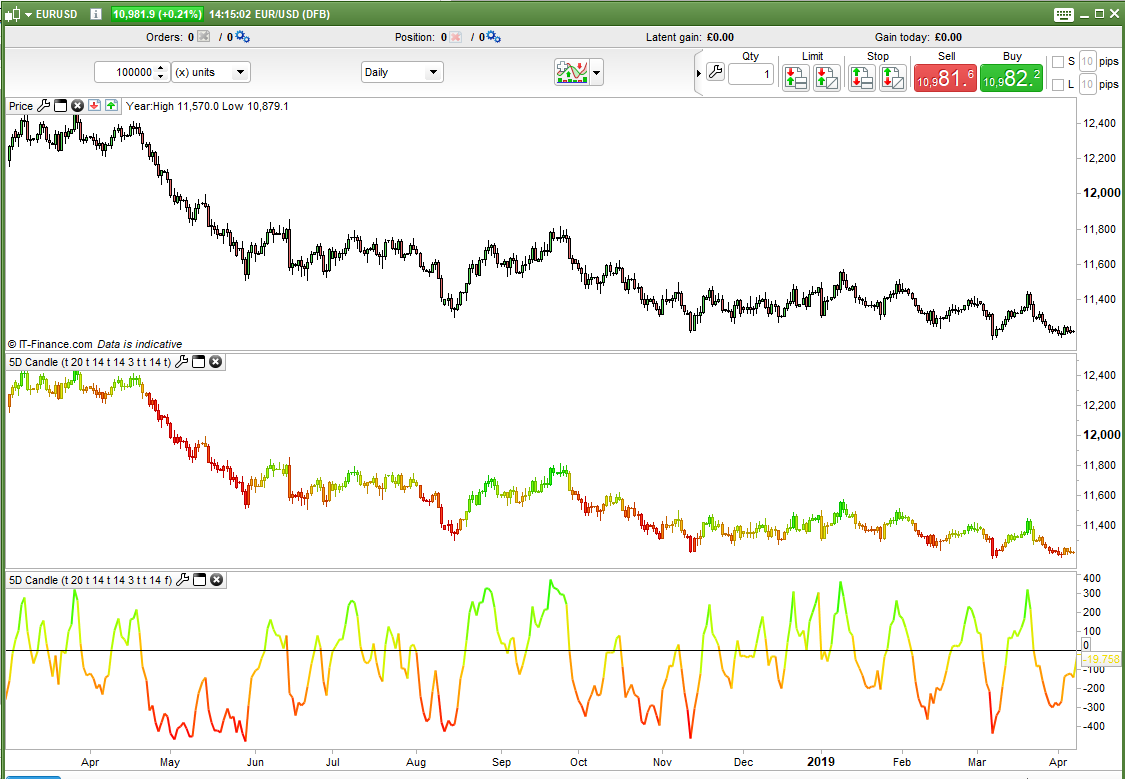
5D Candlesticks and Line Indicator
This indicator is a further development the 3D Candlesticks indicator that can be found here:
https://www.prorealcode.com/prorealtime-indicators/3d-candle/
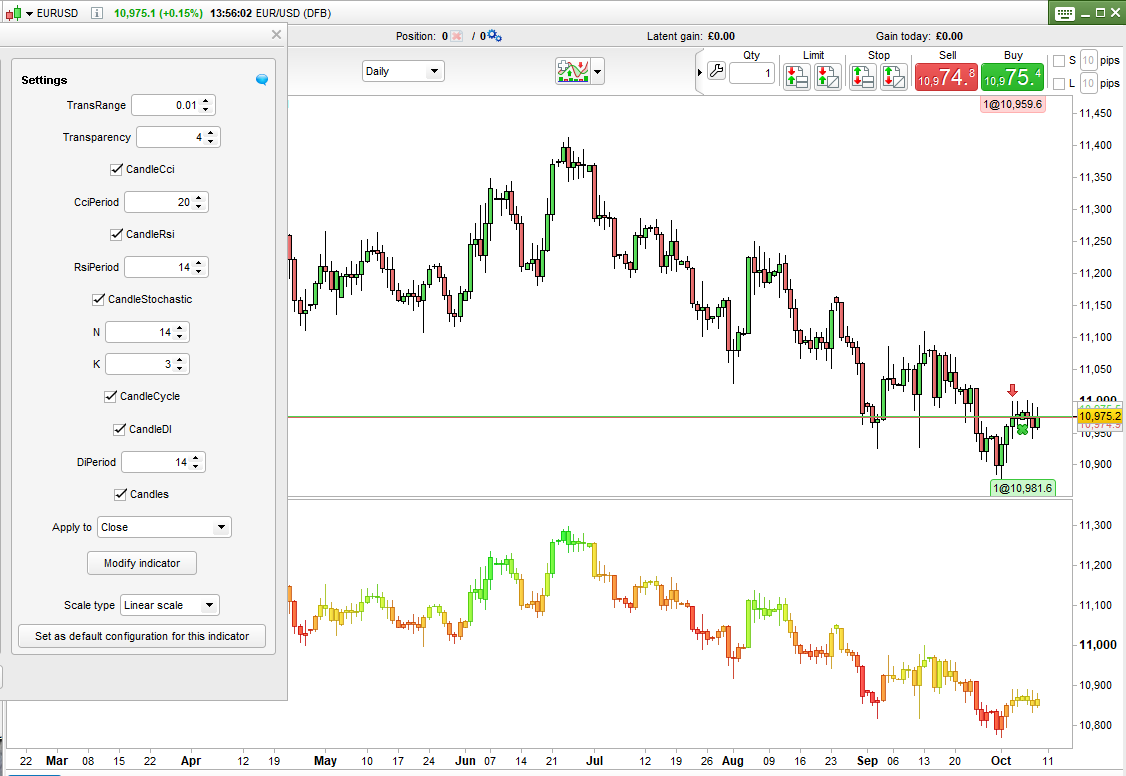
This version allows you to combine any combination of the five indicators and coloured candles are created based on the average of all selected indicator results. The original version only allowed one indicator to be selected at a time.
The five indicators that colours can be based on are:
- COMMODITY CHANNEL INDEX
- RSI
- STOCHASTIC
- CYCLE
- DIRECTIONAL INDEX
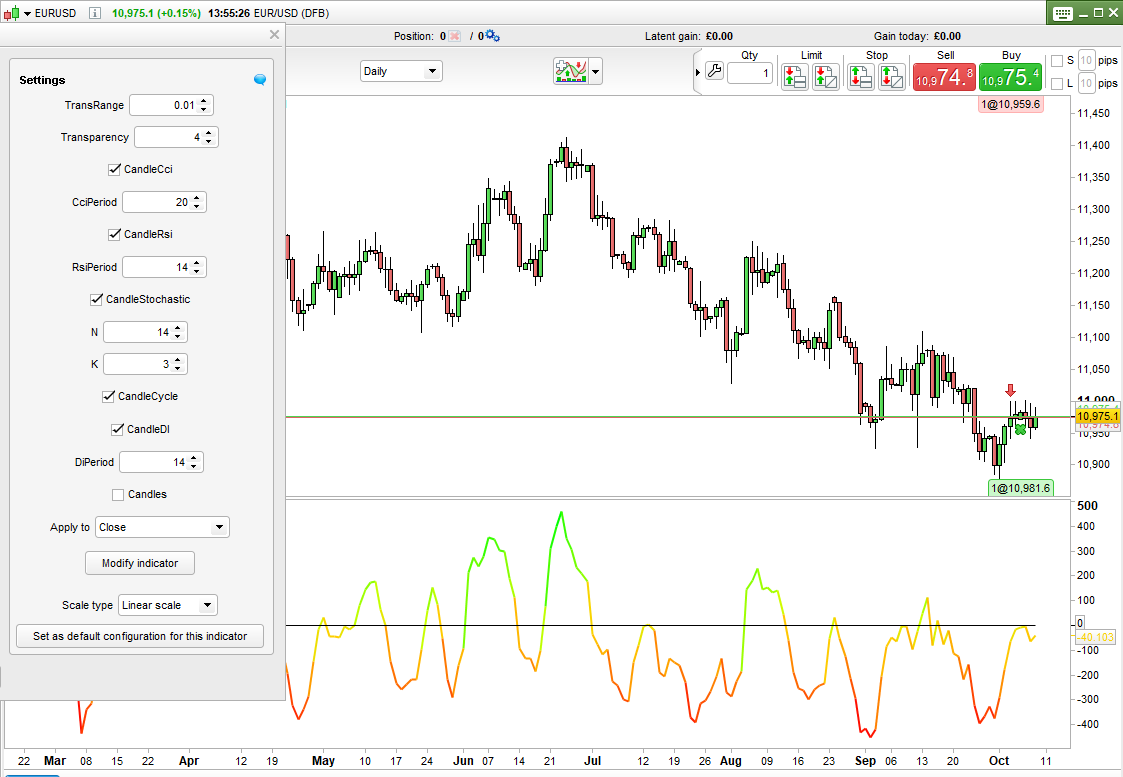
Also in this version it is possible to create a coloured line graph of the result instead of coloured candles. Tick or untick ‘candles’ to change the indicator output type.
I have removed the transparency adjustment as I think it is better to apply the indicator as a separate indicator rather than over the price chart.
Thanks to Ale for the original concept and for some of his original code that I have reused in this new version.
As always I advise downloading the ITF file and importing it to get full functionality.
//5D Candles and Line
//By Vonasi (Thanks to Ale for the original 3D indicator that this is based on)
//20191009

//Candles                    =0       //  1 = candles 0 = line chart

//once CandleCci             =1       // COMMODITY CHANNEL INDEX
//once CandleRsi             =1       // RSI
//once CandleStochastic      =1       // STOCASTIC
//once CandleCycle           =1       // CYCLE
//once CandleDI              =1       // DIRECTIONAL

//once CciPeriod             =20
//once RsiPeriod             =14
//once N                     =14
//once K                     =3
//once DiPeriod              =14

r1 = 0
r02 = 0
r3 = 0
r4 = 0
r5 = 0
g1 = 0
g2 = 0
g3 = 0
g4 = 0
g5 = 0
count = 0

if candlecci then
 MyCci  = Cci[max(1,CciPeriod)](customclose)
 R1 = (200-MyCci)
 G1 = (200+MyCci)
 count = count + 1
endif

if candlersi then
 MyRsi    = RSI[max(1,RsiPeriod)](customclose)
 R02 =50+(200-(MyRsi-50)*12)
 G2 = 50+(200+(MyRsi-50)*12)
 count = count + 1
endif

if candlestochastic then
 MyStoch    = Stochastic[max(1,N),max(1,K)](customclose)
 R3 = 50+(200-(MyStoch-50)*6)
 G3 = 50+(200+(MyStoch-50)*6)
 count = count + 1
endif

if candlecycle then
 MyCycle    = Cycle(customclose)
 R4 = (200-MyCycle*10)
 G4 = (200+MyCycle*10)
 count = count + 1
endif

if candledi then
 MyDi = DI[max(1,DiPeriod)](customclose)
 R5 = 50+(200-MyDi*10)
 G5 = 50+(200+MyDi*10)
 count = count + 1
endif

if count = 0 then
 c = 0
else
 r = (r1 + r02 + r3 + r4 + r5)/count
 g = (g1 + g2 + g3  + g4 + g5)/count
 c = 255
endif

if candles then
 DRAWCANDLE(open, high, low, close) Coloured (R,G,0)
 result = undefined
 zero = undefined
else
 result = g - r
 zero = 0
endif

Return result coloured(r,g,0,c) style(line,2) as "Result", zero as "0"