

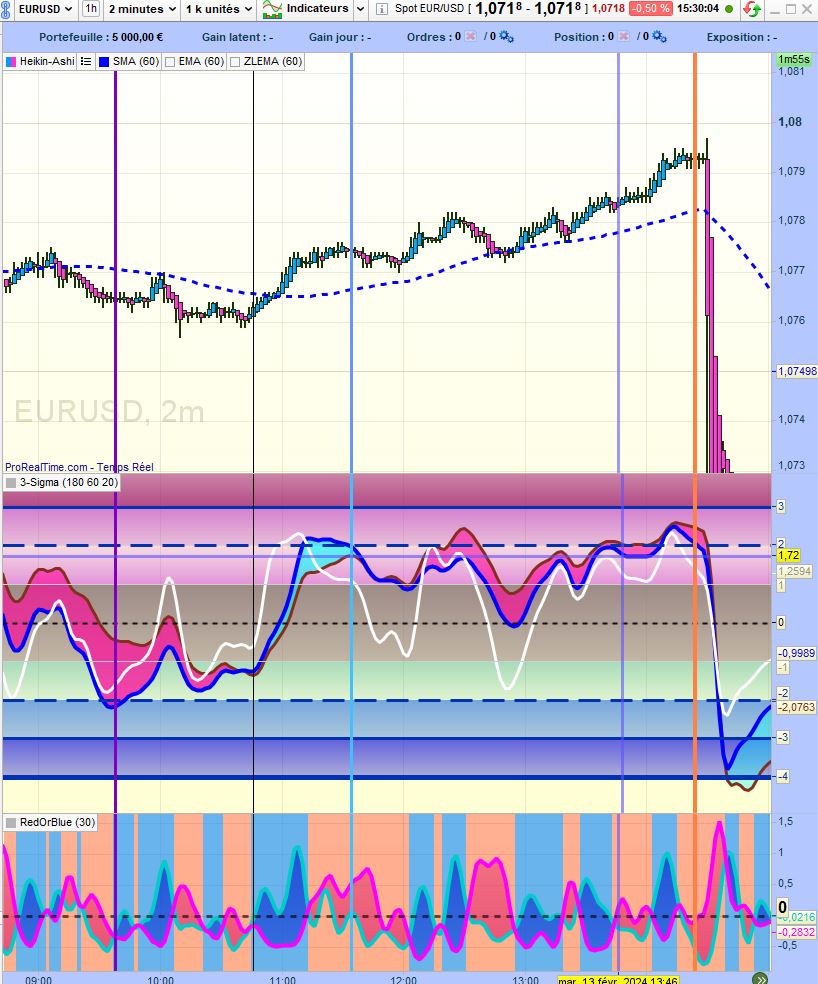
3-Sigma indicator
February 13, 2024, 4:03 PM
Indicators
2 Comments
Whatever stock market values are observed, they do not follow a normal distribution.
normal distribution. To convince ourselves of this, we can simply note that :
– there is no fixed arithmetic mean
– values rise for a time, then fall for another, unless they oscillate in a range.
oscillate within a range.
Nevertheless, it is possible to calculate a sliding average and standard deviation over a given period.
Finally, for each price value, we can calculate a deviation from the mean expressed as a number of standard deviations.
of standard deviations. You can then draw a control chart and see how it behaves.
Please find attached a PDF file with a the complete description in French.
code :
//-------------------------------------------------------------------------------------------------------------
// 3-Sigma Chart
// G. GOUSSET
// 13 Février 2024
//------------------------------------------------------------------------------------------------------------
// Périodes : mieux vaut les placer en variables externes

TLongPer = 180
LongPer = 60
ShortPer = 20

//-------------------------------------------------------------------------------
// centrage réduction des données

a = (close - Average[TLongPer](close))/STD[TLongPer](close)
b = (close - Average[LongPer](close))/STD[LongPer](close)
c = (close - Average[ShortPer](close))/STD[ShortPer](close)

//------------------------------------------------------------------------------
// lissage
r = 4
s = 3
u = 2
ValTLong =average[u](average[s](average[r](a)))
ValLong =average[u](average[s](average[r](b)))
ValShort =average[u](average[s](average[r](c)))

//------------------------------------------------------------------------------
// niveaux intéressants à repérer
zero = 0
un = 1
deux = 2
trois = 3
mun = -1
mdeux = -2
mtrois=-3
quatre = 4
mquatre = -4
// -----------------------------------------------------------------------------
// graphes

Return ValTLong coloured (132,46,27,300) as "Sig Très Long", ValLong coloured (0,0,255) as "Sig Long", ValShort coloured (255,255,255,250) as "Sig Short", zero coloured (18,13,22) as "ligne zéro",deux coloured (1,49,180) as "2", trois coloured (1,49,180) as "3", mdeux coloured (1,49,180) as "-2", mtrois coloured (1,49,180) as "-3", un coloured (206,206,206) as "1", mun coloured (206,206,206) as "-1",quatre coloured (1,49,180) as "4",mquatre coloured (1,49,180) as "-4"
Download
Filename:
Sigma-3-indicator.itf
Downloads:
74
New
As an architect of digital worlds, my own description remains a mystery. Think of me as an undeclared variable, existing somewhere in the code.
Author’s Profile
Loading...