

Dynamic RGB color matrix for technical indicator
Sometimes we need color changing accordingly to the indicator value, that’s why I created this dynamic color scale matrix that can be added to any already made indicator of any kind in Prorealtime 10.3 and above version.
Dynamic color gradient
The idea behind this code is to modify dynamically the color gradient between a predefined color in 2 separate scale, a positive and a negative one (dark green for bullish sentiment in the example below and dark violet for bearish sentiment) and a middle value that can be adjusted to any value at will in the code.
Let’s take a simple MACD histogram:
myMACD = MACD[12,26,9]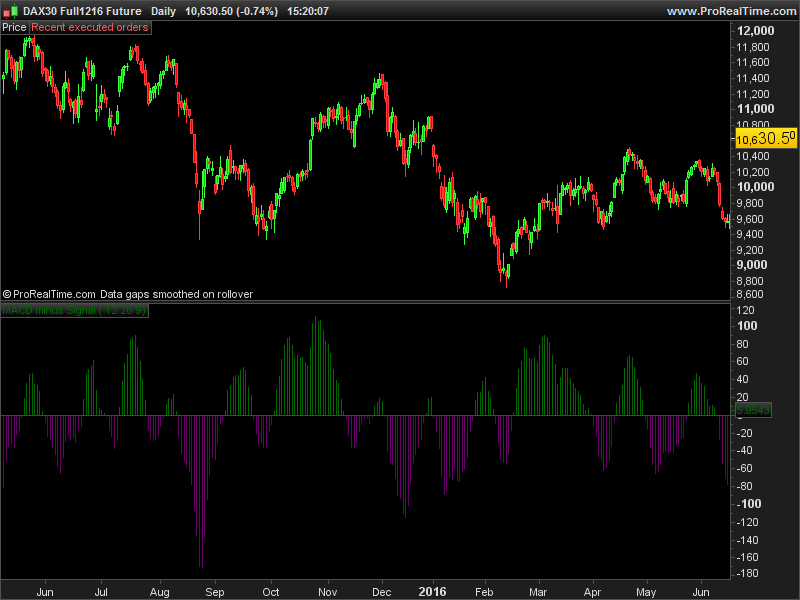
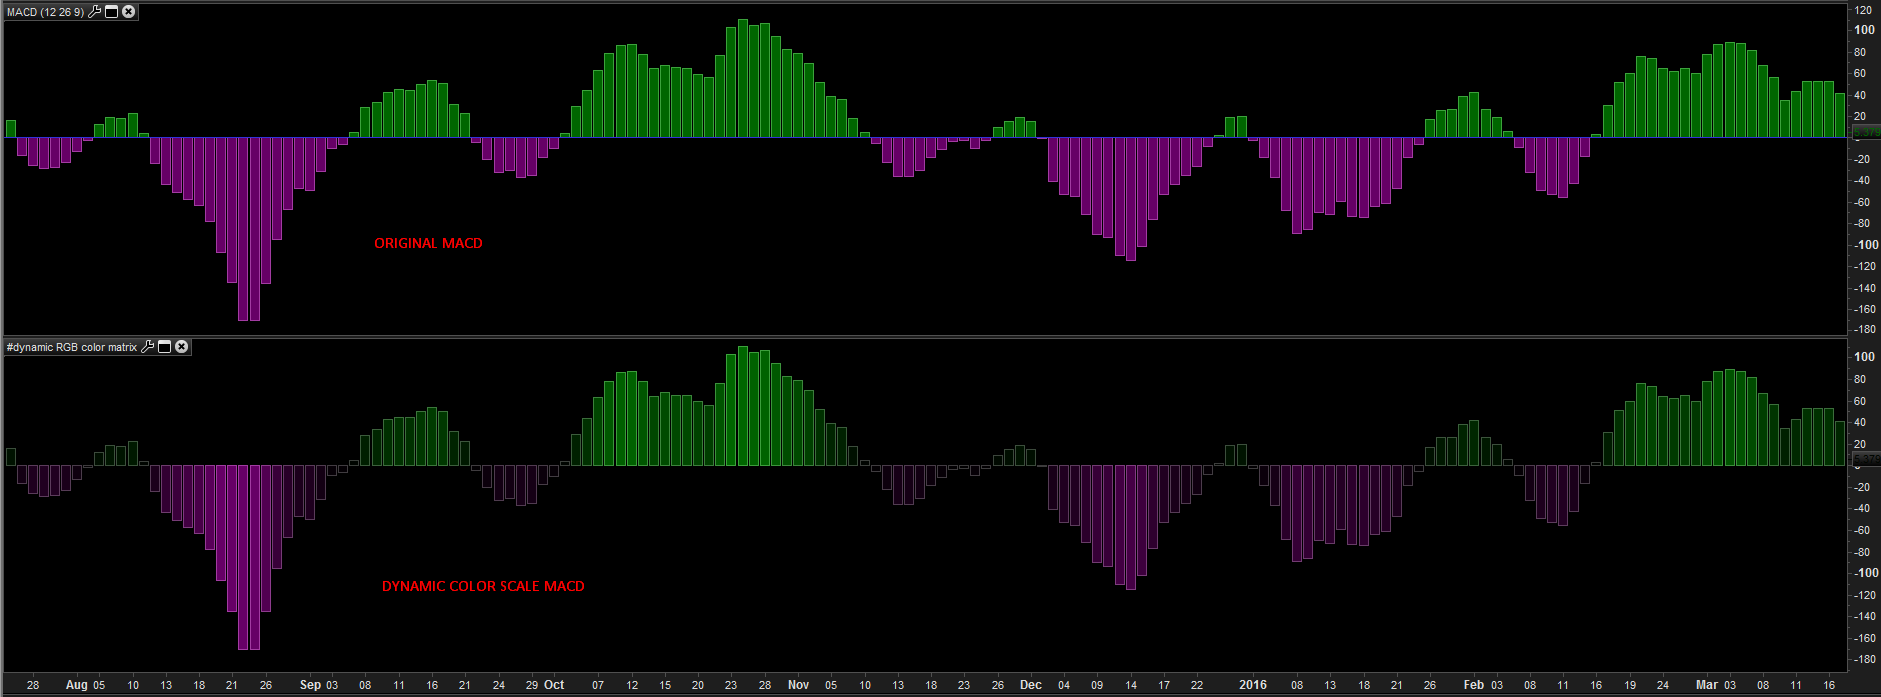
and make it have a better look of what’s currently happen:
How to set the dynamic color scale for any indicator?
Firstly, we have to set what is the variable of the indicator that need to be coloured by the gradient scale, this is defined in our code with the “valueentry” variable, which here is equal to the MACD histogram value. Easy!
valueentry = myMACD //data entry for automatic color scalingThen, we need to define the RGB (Red,Green,Blue) values of the positive (or buy zone) and the negative (sell zone) of the 2 colors we’d like to be gradually displayed.
In our example, the green color is: 0,102,0 (R,G,B) and the violet one is 102,0,102 (R,G,B)
maxr = 0 //R of RGB value for "bullish" sentiment/zone
maxg = 102 //G of RGB value for "bullish" sentiment/zone
maxb = 0 //B of RGB value for "bullish" sentiment/zone
minr = 102 //R of RGB value for "bearish" sentiment/zone
ming = 0 //G of RGB value for "bearish" sentiment/zone
minb = 102 //B of RGB value for "bearish" sentiment/zone
Finally, the indicator’maximum, minimum and middle values have to be defined in these 3 lines below:
maxvalue = highest[200](valueentry) //could be modified by the maximum value in a bounded oscillator
middlevalue = 0 //middle value of the indicator
minvalue = lowest[200](valueentry) //could be modified by the minimum value in a bounded oscillator
What I have done here is to set a dynamic maximum and minimum value for the example, since a MACD don’t have any fixed max/min area. This is not the case for any other bounded indicators, such as a RSI or a stochastic oscillator for instance, so if you want to add this color scale to an indicator that oscillate between 100 and -100, the “maxvalue” and “minvalue” should be set like this:
maxvalue = 100
middlevalue = 0 //middle value of the indicator
minvalue = -100
Full code example:
myMACD = MACD[12,26,9]
// --- ProRealcode RGB color matrix for PRT v10.3
valueentry = myMACD //data entry for automatic color scaling
maxr = 0 //R of RGB value for "bullish" sentiment/zone
maxg = 102 //G of RGB value for "bullish" sentiment/zone
maxb = 0 //B of RGB value for "bullish" sentiment/zone
minr = 102 //R of RGB value for "bearish" sentiment/zone
ming = 0 //G of RGB value for "bearish" sentiment/zone
minb = 102 //B of RGB value for "bearish" sentiment/zone
maxvalue = highest[200](valueentry) //could be modified by the maximum value in a bounded oscillator
middlevalue = 0 //middle value of the indicator
minvalue = lowest[200](valueentry) //could be modified by the minimum value in a bounded oscillator
absmaxvalue = abs(maxvalue)
absminvalue = abs(minvalue)
absmidvalue = abs(middlevalue)
if valueentry>absmidvalue then
r = maxr/(absmaxvalue-absmidvalue)*valueentry
g = maxg/(absmaxvalue-absmidvalue)*valueentry
b = maxb/(absmaxvalue-absmidvalue)*valueentry
else
r = abs(minr/abs(absminvalue-absmidvalue)*valueentry)
g = abs(ming/abs(absminvalue-absmidvalue)*valueentry)
b = abs(minb/abs(absminvalue-absmidvalue)*valueentry)
endif
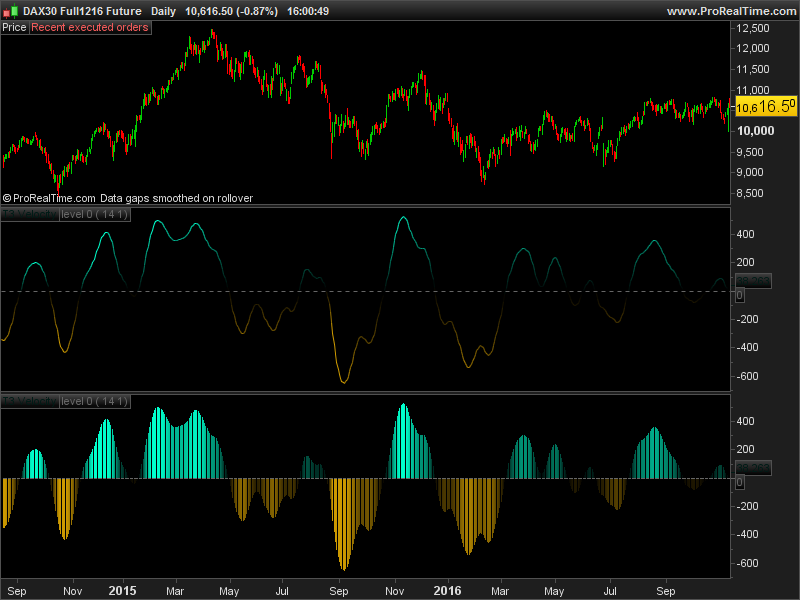
return myMACD coloured(r,g,b)Another example with an indicator of the library, the T3 Velocity:
This code example could be of course improved to perform a continuous grading color from negative to positive areas (like a rainbow ..), I may code it later. Enjoy this code and make your indicators even more beautiful 🙂
Once again, you can find the full code as ITF files that can be downloaded below this article.