 PRINT
PRINTThe PRINT function is used to display the variable value for each candle in a table. Like the GRAPH and GRAPHONPRICE instructions it is intended to help debugging.
ProRealTime documentation
 PROFIT
 PRTBANDSDOWN
Returns the PRT Bands lowest band.
Syntax:
|
1 |
PRTBANDSDOWN |
Example:
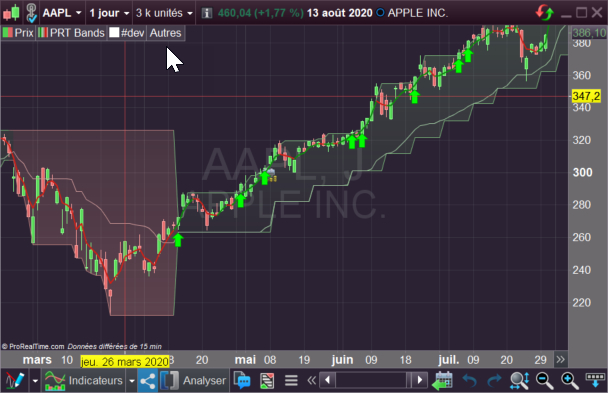
Plot a down arrow above the candlestick when the Close crosses under the lowest band
|
1 2 3 4 5 6 7 |
a = PRTBandsDown //plot a down arrow above the candle when the Close crosses under the bands if close crosses under a then drawarrowdown(barindex,high+averagetruerange[14]/2) coloured(255,0,0) endif return |
Returns the PRT Bands mid term band
Syntax:
|
1 |
PRTBANDSMEDIUMTERM |
Example:
screener that list all shares that mid term band is suddenly ascending while it was resting at the same price during the last 5 bars.
|
1 2 3 4 5 |
a = PRTBandsmediumterm result = a>a[1] and summation[5](a=a[1])[1]=5 screener[result] |
Returns the PRT Bands short term band
Syntax:
|
1 |
PRTBANDSSHORTTERM |
Example:
screener that list all shares that short term band just made an ascending hook.
|
1 2 3 4 5 |
a = PRTBandsShortTerm result = a>a[1] and a[1]<a[2] screener[result] |
Returns the PRT Bands highest band.
Syntax:
|
1 |
PRTBANDSUP |
Example #1:
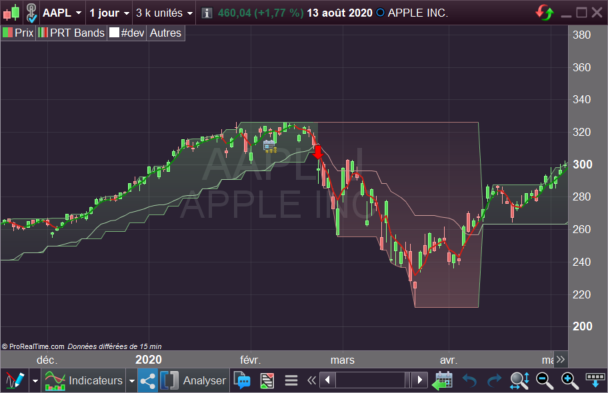
Detect the trend change (from bearish to bullish trend), channel change from red to green
|
1 2 3 4 5 6 7 8 9 10 11 12 13 14 15 16 17 18 |
up = PRTBandsUp dn = PRTBandsDown if close crosses over up and trend<=0 then //price breaks the upper band trend=1 //new bullish trend r=0 g=255 elsif close crosses under dn and trend>=0 then //price breaks the lower band trend=-1 //new bearish trend r=255 g=0 endif signal = trend<>trend[1] //trend inversion signal backgroundcolor(r,g,0,50) //color the chart background with the trend direction color return signal style(histogram) as "trend inversion", trend coloured(r,g,0) as "trend direction" |
Example #2:
Plot a up arrow below the candlestick when the Close crosses over the upper band
|
1 2 3 4 5 6 7 |
a = PRTBandsUp //Plot a up arrow below the candlestick when the Close crosses over the upper band if close crosses over a then drawarrowup(barindex,low-averagetruerange[14]/2) coloured(0,255,0) endif return |
Return value of the Price Volume Trend indicator also knows as PVT, for a selected price.
Syntax:
|
1 |
PVT(price) |
Calculation :
%var = (close – yesterday’s close) / (yesterday’s close)
PVT = %var * today’s volume + yesterday’s PVT
Instruction used to stop a trading system. All opened, stop and limit orders are close when the instruction is used.
Stopped strategy with the QUIT instruction cannot be re-launched automatically by code. Only a manual intervention can do it.
Syntax:
|
1 |
QUIT |
Example1 :
Stop the automated trading program at 22:00 if we are short on market.
|
1 2 3 |
IF ShortOnMarket AND CurrentHour=22 THEN QUIT ENDIF |
Example2 :
Stop the strategy if the actual profit is losing 200 of the money account.
|
1 2 3 |
IF StrategyProfit<-200 then QUIT ENDIF |
Return the R-Squared indicator value over the last N periods (error rate of the linear regression on price).
Syntax:
|
1 |
R2[N](price) |
Example:
|
1 2 3 4 5 6 7 8 9 10 11 12 13 14 15 16 |
i1 = R2[20](close) LR1 = linearregression[20](close) LR2 = linearregression[20](close[1]) if(i1>0.4 AND LR1<LR2) THEN bullish = 0 bearish = -1 ELSIF i1>0.4 AND LR1>LR2 THEN bullish = 1 bearish = 0 ELSE bullish = 0 bearish = 0 ENDIF RETURN bullish, bearish |