

Amazon / Alibaba
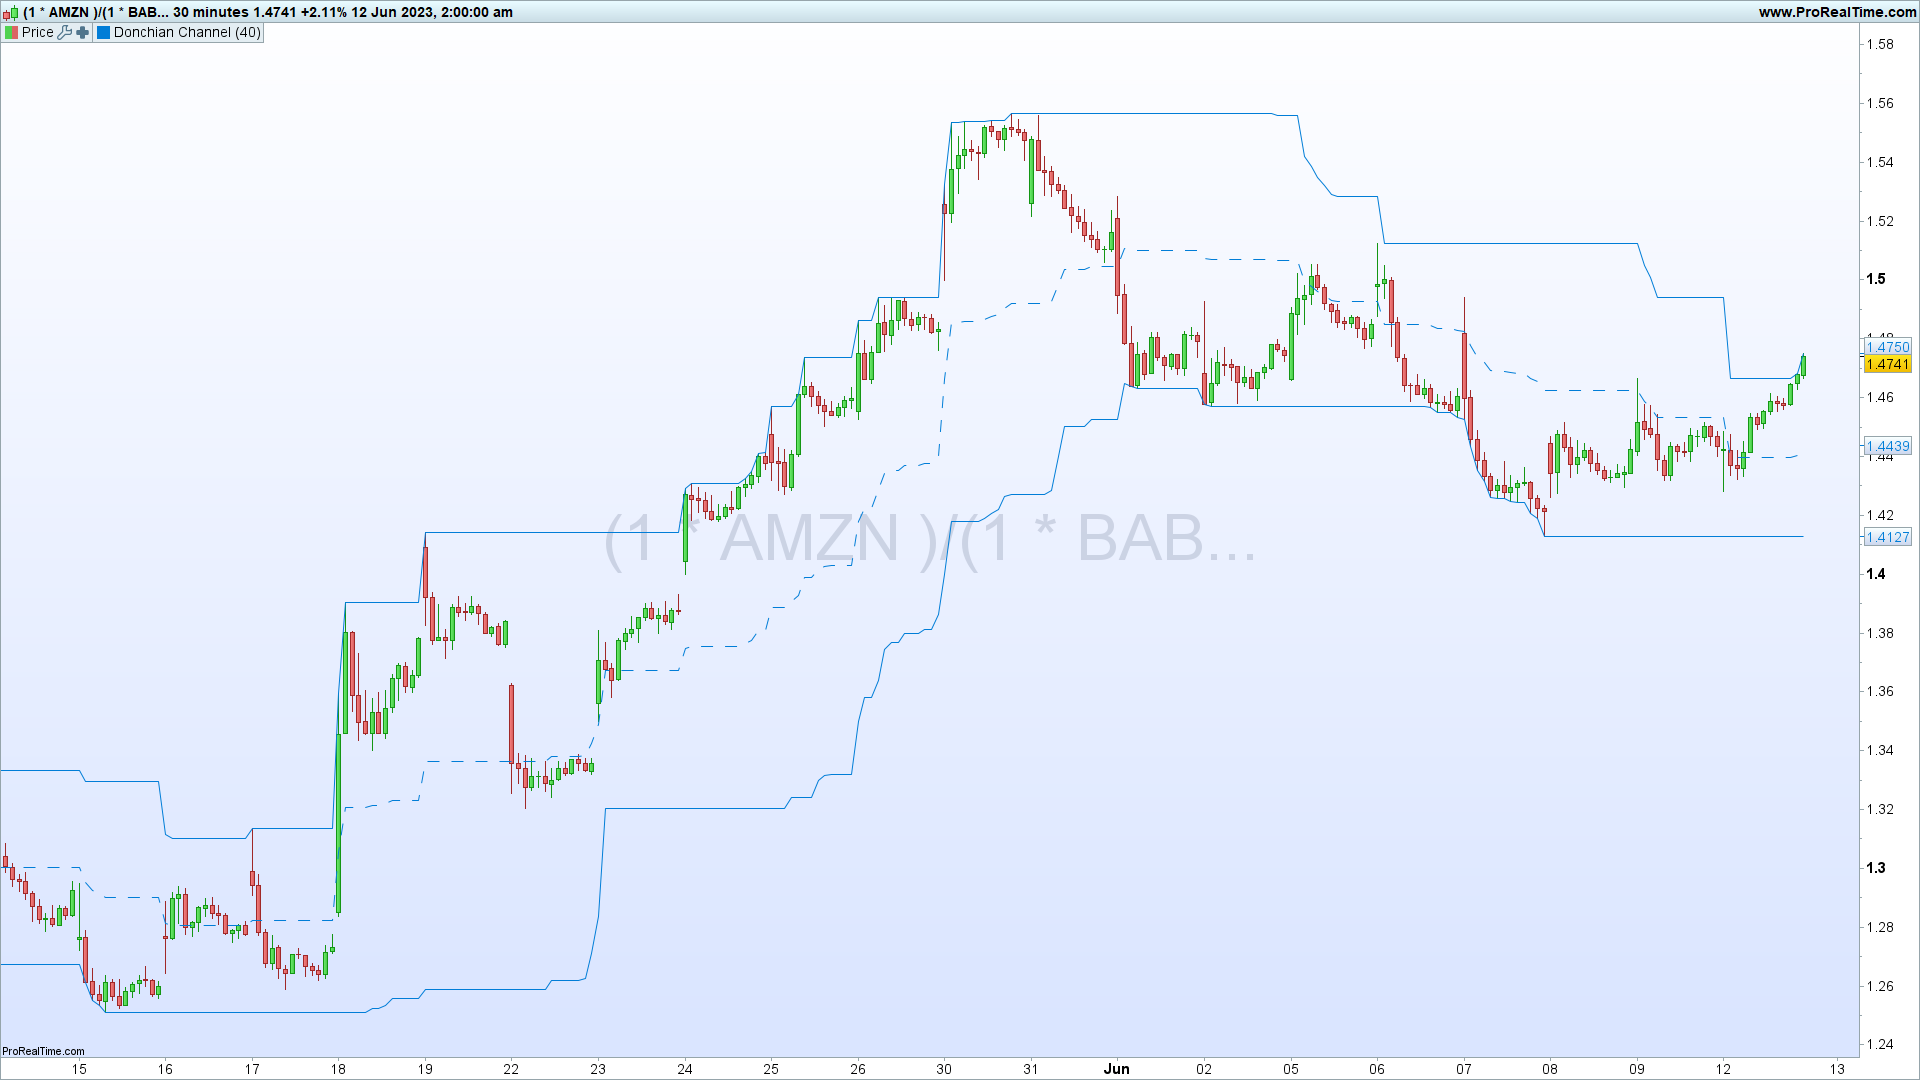
This formula ( 1 * AMZN ) / ( 1 * BABA ) is creating a spread between two stocks, Amazon (AMZN) and Alibaba (BABA). A spread is the difference between two or more similar financial instruments.
In this case, we are looking at the ratio of the price of Amazon stock to the price of Alibaba stock. This would create a spread chart showing how the price of Amazon stock changes in relation to the price of Alibaba stock.
If the line in the spread chart is increasing, it means that Amazon stock is outperforming Alibaba. That could be due to Amazon’s price rising faster than Alibaba’s, Alibaba’s price falling faster than Amazon’s, or some combination of the two. If the line in the spread chart is decreasing, it means that Alibaba stock is outperforming Amazon.
Such a spread chart is often used in pairs trading strategies, where traders go long (buy) the outperforming stock and short (sell) the underperforming stock, betting on the convergence or divergence of the two stocks. Pairs trading is a type of statistical arbitrage strategy that is market neutral (dependent on the relationship between two stocks rather than the overall market trend).