

52-Weeks-High entry point
May 22, 2018, 8:21 AM
Indicators
0 Comments
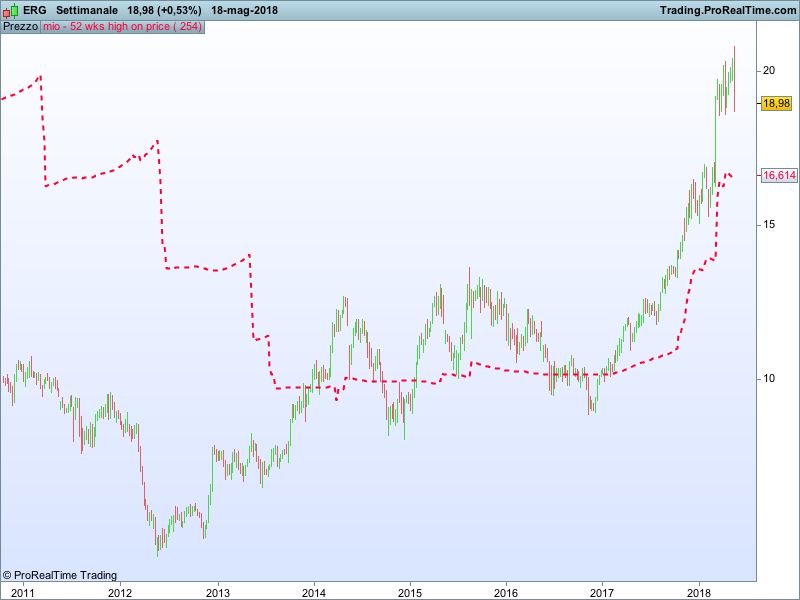
One of the most efficient strategies in fundamental analysis is entering the market when a stock is close to the 52 weeks high. This strat has been proofed to be successful throughout the decades with good earnings. This indicator will graphically tell you when you are entering the buffer for successfully applying such a strategy.
You can overlay this indicator on the price window. When the price crosses above the 52-week-high line it’s time to add the stock to your portfolio and when crosses under time to dump it.
Blue skies!!
a=highest[period](high[1])
cutbasso=(a-1.5*std[254](close))


return cutbasso style (dottedline)
Download
Filename:
PRT-52-wks-high-on-price.itf
Downloads:
206
Master
As an architect of digital worlds, my own description remains a mystery. Think of me as an undeclared variable, existing somewhere in the code.
Author’s Profile
Loading...