

Statistical trading with normal distribution
Every instrument has its own price distribution, in this article I deal with the fact that a normal distribution (also known as a bell curve), can give us a tip at where the price could go in the next few bars. I will use some distribution formula to draw bell curve right into ProRealTime charts.
Plotting a normal distribution of the instrument
A mathematical distribution is a simple representation of the price behaviour around a mean. There are a lot of distribution of price that can be found, what we want here is to find the best mean of price over a large timescale, because a good statistical approach mean a lot of information.
A normal distribution of price :
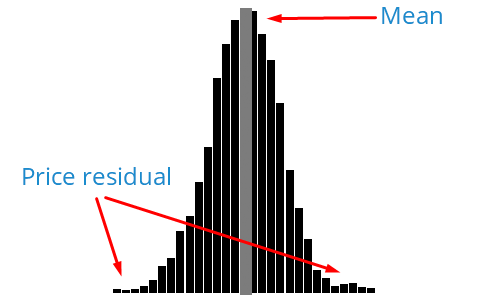
What we can observe here is that when the price derivates a lot from its mean, it will not be there too long, because each segment of this distribution plot is a cumulative of the price position over the study period (as much barindex as your ProRealTime chart is actually showing).

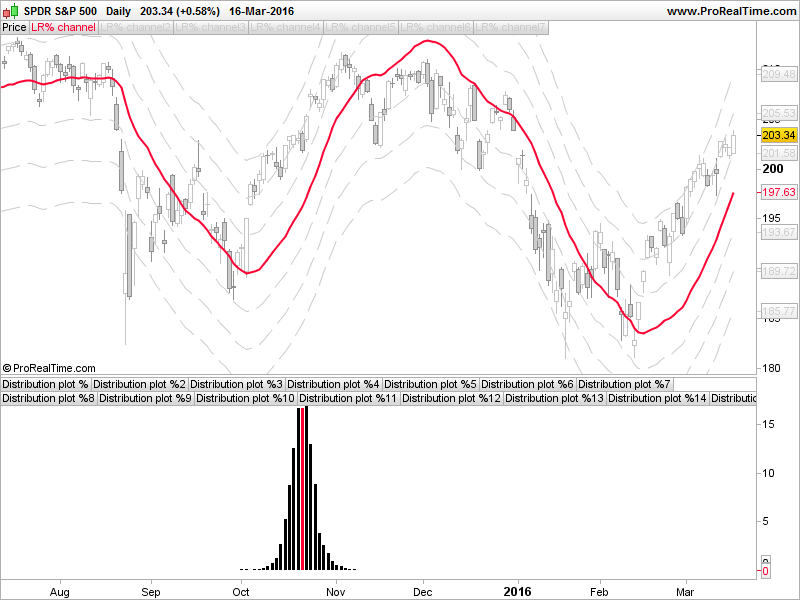
Different instrument (SPDR XLE and SP500 ETF) show different normal distribution. Each bar in the plot represent a 1 percent deviation of the price from its mean. On the Y axe, we have the percentage of this deviation representation over the whole study.
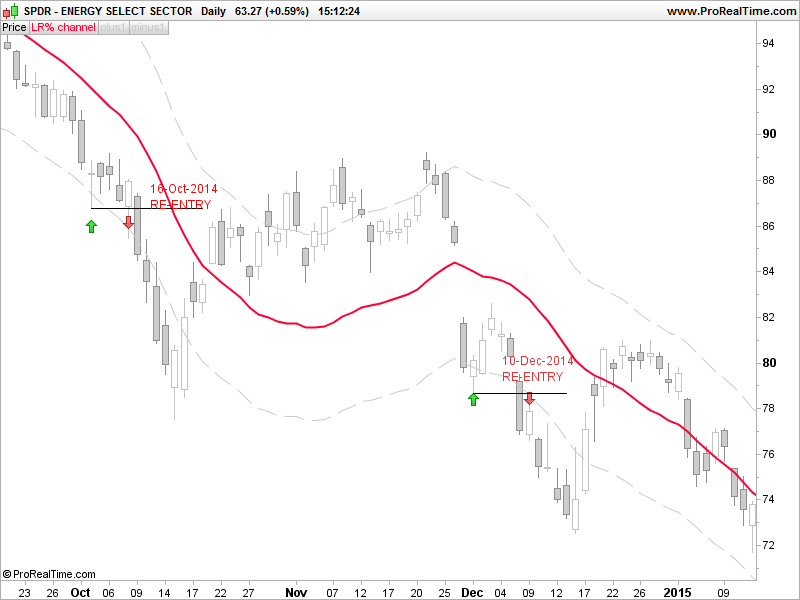
Building a channel where 80% of the price is living
A simple channel could be build upon what we observe through our price distribution. If the price is living 80% into the channel, we can assume that if the price exceed this deviation limit it could :
- revert to the mean
- continue in that direction, outer channel

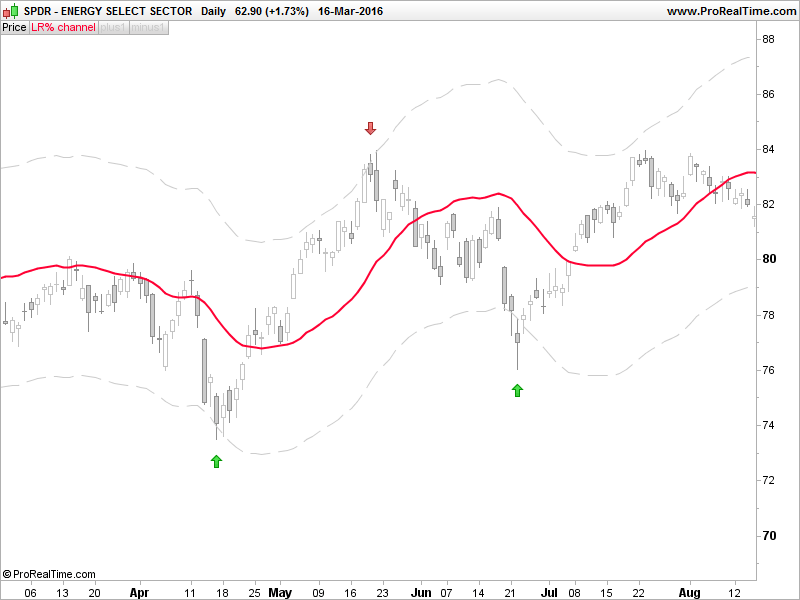
As for the XLE ETF, we find that a 5% deviation from the mean has 80% of the price distribution, so we can draw a channel with an upper and a lower band made of this observation:
Nope, it’s not magical, it’s statistical! 🙂
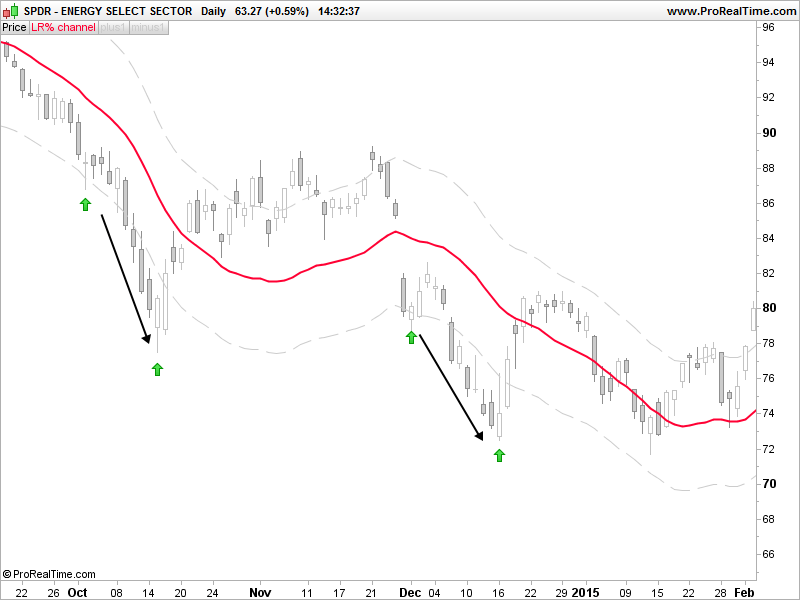
Of course, price doesn’t always revert to its mean quickly and that’s where is the major con of this strategy :
Different timing/period for a better entry?
Well, no one will never know where the price will be in a hour or even in the next few minutes. So while there are different manner of dealing with losing trade (averaging down, martingale, ..), I would prefer to take my loss and go on next trade. There are no easy path to follow when you are trading counter-trend and I’m not gonna tell you that this kind of strategy is the better approach for “easy” trading 🙂
In that specific losing trade, a tip would be to re-enter, this time in the trend direction, just below your previous candle entry, this time to follow the herd like a good sheep 🙂
To conclude..
Of course I assume in my example that a 50 period linear regression is the best mean to trade this statistical strategy. It could be a part of another study, finding the best mean for each instrument, maybe .. I’m looking forward for react about this article, how to optimize it and find an edge about it, dealing with losing trade, etc. Anyway, you’ll find the different files at the bottom of the post, the distribution indicator and the channel one.