

Daily candlestick on any timeframe chart
May 25, 2016, 10:15 PM
Indicators
6 Comments
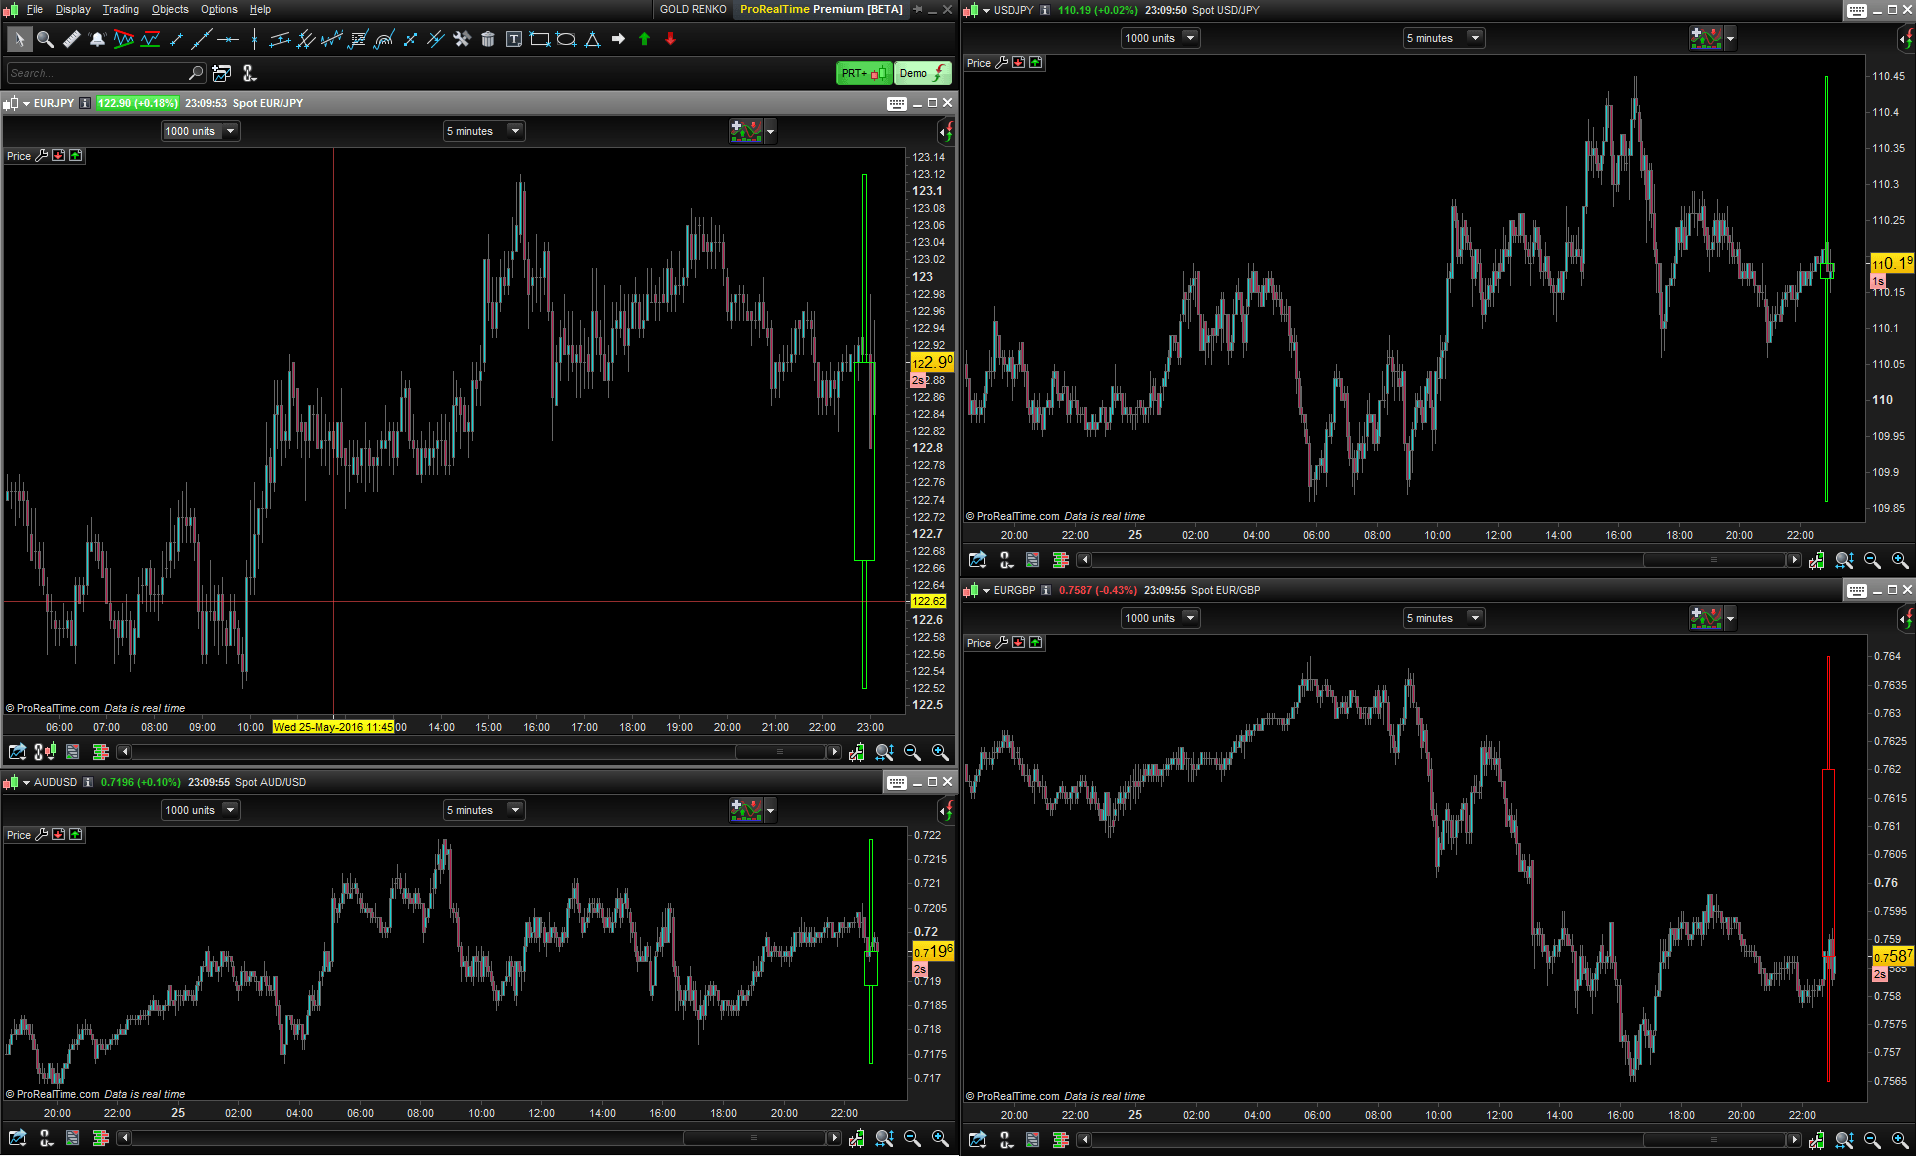
This indicator draw the actual daily candlestick on any timeframe. You can change the visibility of the candlestick with the “alpha” variable set from 0 to 255 which change the transparency of it. It is not possible to draw objects on the right of the chart, so the candle is displayed overlayed of the price.
The candlestick is made of rectangles drawn with the new graphical objects of the 10.3 version of the platform.
defparam drawonlastbaronly = true

alpha = 255 //from 0 to 255 to change alpha transparency

dop = dopen(0)
dhi = dhigh(0)
dlo = dlow(0)
dcl = dclose(0)

//candlestick color
if dop>dcl then
direction = -1
else
direction = 1
endif

//bullish candle
if direction = 1 then
 //candlestick body
 DRAWRECTANGLE(barindex-5,dop,barindex,dcl) COLOURED(10,255,10,alpha)
 //candlestick high and low
 DRAWRECTANGLE(barindex-3,dcl,barindex-2,dhi) COLOURED(10,255,10,alpha)
 DRAWRECTANGLE(barindex-3,dop,barindex-2,dlo) COLOURED(10,255,10,alpha)
endif

//bearish candle
if direction = -1 then
 //candlestick body
 DRAWRECTANGLE(barindex-5,dcl,barindex,dop) COLOURED(255,10,10,alpha)
 //candlestick high and low
 DRAWRECTANGLE(barindex-3,dop,barindex-2,dhi) COLOURED(255,10,10,alpha)
 DRAWRECTANGLE(barindex-3,dcl,barindex-2,dlo) COLOURED(255,10,10,alpha)
endif

RETURN
Download
Filename:
Daily-Candlestick.itf
Downloads:
188

New
Trader, Programmer, Coder enthusiast. Work with each other for a common goal.
Author’s Profile
Comments
Loading...