

Buy and Hold comparison for automated trading strategies
Do my new automated strategy worth to be traded? Is it better than an old “buy and hold” strategy? Let’s see how we can make comparison in this blog article.
Buy and Hold strategy, what is it?
Buy and hold strategy is nothing more than buy an instrument and hold it without doing anything than watch it grows your initial balance. It’s pure passive investment and it’s still something largely “traded” for retirement plans for example.
It’s sometimes more profitable than doing more than one order operation on the same share and that’s the reason it is often used as a comparison to fully automated trading strategies.
How to compare result with buy and hold?
Let’s say that we have a simple strategy made of breakout of the recent highest high with a 200 period moving average acting as a trend filter. Orders are closed with price crossing under more recent lowest low.
defparam cumulateorders=false

//highest high large period
hh = highest[100](high)

//lowest low short period
ll = lowest[35](low)

//trend filter
trend = close > average[200]

//buy trigger
if close crosses over hh[1] and trend then
 BUY 1 SHARE AT MARKET
endif

//exit position
if close crosses under ll[1] then
 SELL AT MARKET
endif
Of course this kind of compare is only possible with long only strategies, because we are comparing with passive investment, no short positions could be used.
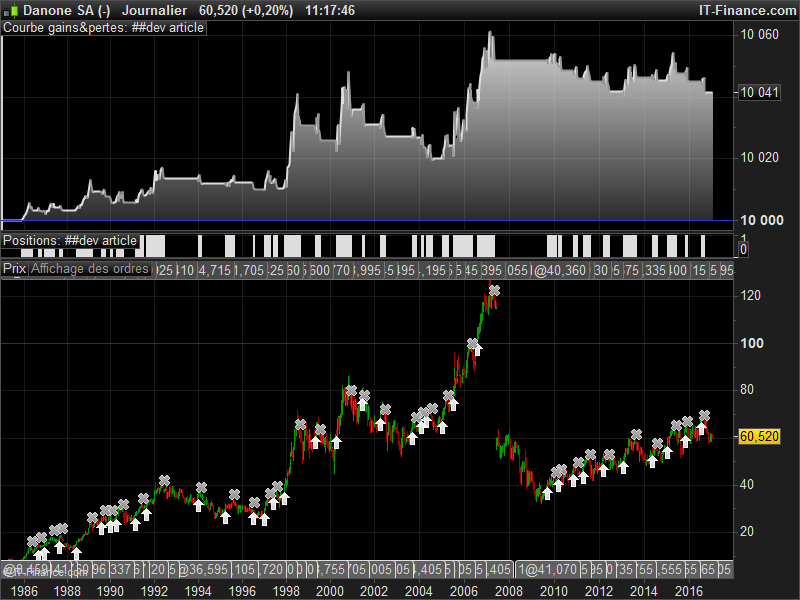
This simple strategy produce gain because trend is bullish since a while. To compare with buy and hold, we must use the exact same conditions than the strategy itself:
- same initial capital
- same start date for investment
- same price entry as the first trade
What we want here is to set a new indicator that can draw a curve of the buy and hold equity directly over the gain/loss equity produce by the backtest. This way, comparison should be easier.
Let’s define the same parameters in a new indicator called “buyandhold”:
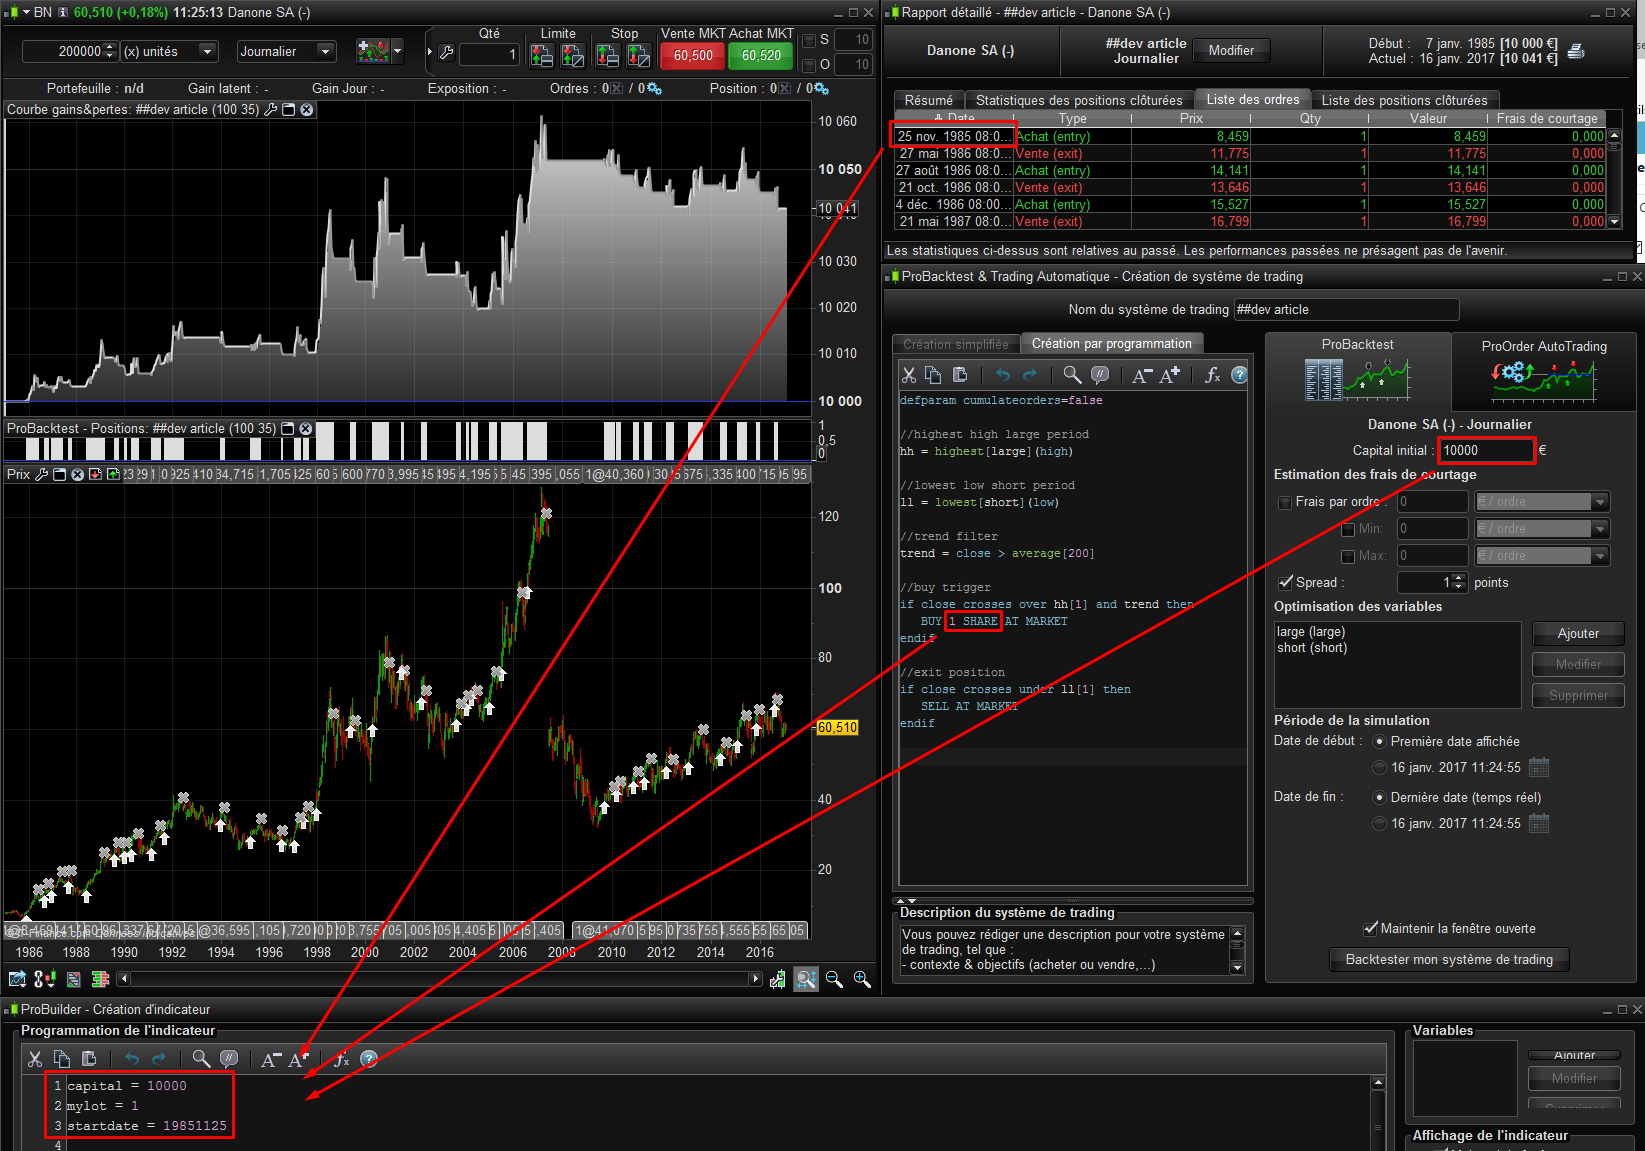
balance = 10000
mylot = 1
startdate = 19851125
Once these parameters are defined, we could do some calculation:
once firstclose = 0
if date>=startdate then
 if firstclose = 0 then
 //save the current close once when the comparison start
  firstclose = close
 endif
 //calculate buy and hold with pointvalue and pointsize of the current share
 buyandhold = balance+(((close-firstclose)*pointvalue)*mylot)/pointsize
else
//if the displayed date is previous from the startdate, let's draw the buy and hold curve as the balance
 buyandhold = balance
endif

RETURN buyandhold coloured(255,128,0)
Here is what we got on the equity curve chart, when the indicator is applied on it (use the wrench on the upper left side of the window):
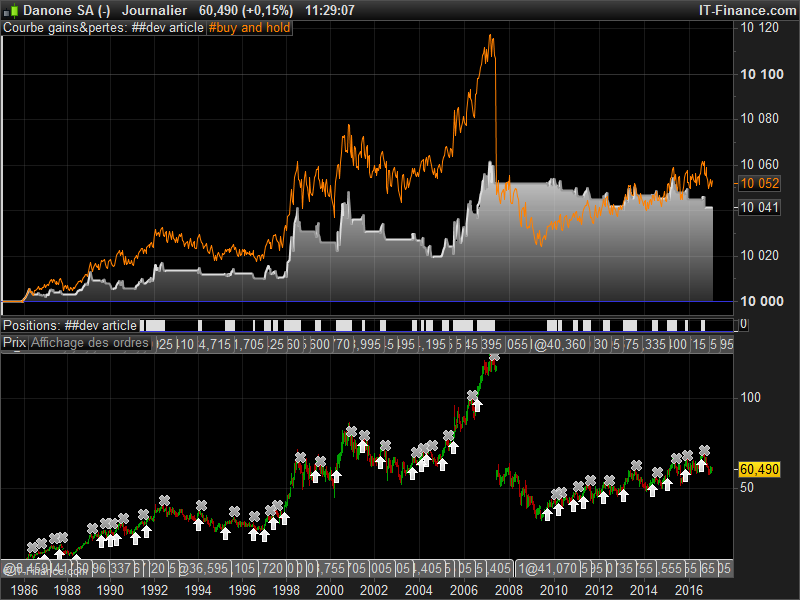 As you can see in this example, buy and hold is better investment until a sudden gap crash was observed in mid 2007 (orange curve).
Done. This code snippet is a great tool for automated trading development, hope you’ll find it useful!
Of course, comparison should also be made on many others criteria such as drawdown, fees, risk/reward ratio, etc. but it were not the purpose of this approach.