

Market Scans (ProScreener)
Introducing ProScreener
ProScreener is a high-performance scanning tool that lets you scan entire markets:
- to find values that meet one or more of the conditions you’ve defined.
- in one or more time units (e.g. 1 minute and 1 hour)
- in real time or at the close of each bar with tick-by-tick precisi
Introducing ProScreener
ProScreener is a high-performance scanning tool that lets you scan entire markets:
- to find values that meet one or more of the conditions you’ve defined.
- in one or more time units (e.g. 1 minute and 1 hour)
- in real time or at the close of each bar with tick-by-tick precision
ProScreener integrates the ProBuilder programming language (please read the manual beforehand) with extensions that apply exclusively to filter conditions. Real-time or bar-closing searches can be applied to the following time units:
- 1 minute
- 2 minutes
- 3 minutes
- 5 minutes
- 10 minutes
- 15 minutes
- 30 minutes
- 1 hour
- 2 hours
- 3 hours
- 4 hours
- Daily
- Weekly
- Monthly
- Quarterly
- Annual
ProScreener uses the last 256 candlesticks (1024 for premium platforms) of the chosen time unit to calculate your code.
The results of a ProScreener search are displayed as a list of the 50 or 100[*] best values (chosen from the results) based on the defined sort criterion.
This document is an extension of the ProBuilder manual, but can be read independently. Through a guided theoretical approach and concrete examples, you will learn the basics of indicator programming, enabling you to use ProScreener-specific commands to define filters for the various markets available on the platform. At the end of this module, you’ll find a Glossary that will give you an overview of all the commands that can be used in this module.
If you have any further questions about how the ProScreener works, you can ask our ProRealTime community on the ProRealCode forum, where you’ll also find online documentation with numerous examples.
We wish you every success! Enjoy your reading!
[*] Depending on the ProRealTime version used
Chapter I: Fundamental concepts
Go to ProScreener
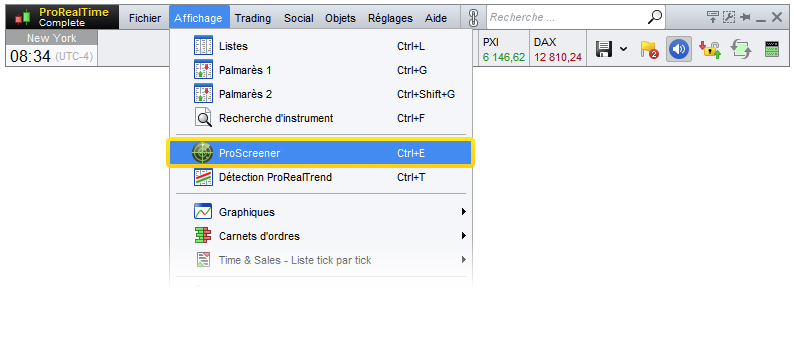
You can access the ProScreener module by clicking on “View” then “ProScreener”, as shown below:
This brings up the ProScreener window, where you can select an existing code or create a new one.
To do this, click on the key to open the “ProScreeners Management”, then click on “Create” or “Modify” to access the programming window, which offers the choice between :
- Assisted programming”, which lets you define search criterion conditions without programming (to learn more about this feature, we recommend watching the video, “Creating a ProScreener without writing a line of code“).
- Programmed creation”, which lets you create more complex codes and define application parameters.
The Programmed Creation window is divided into 4 sections:
- Programming area
- Selection type
- Time period and sorting direction
- List/group selection
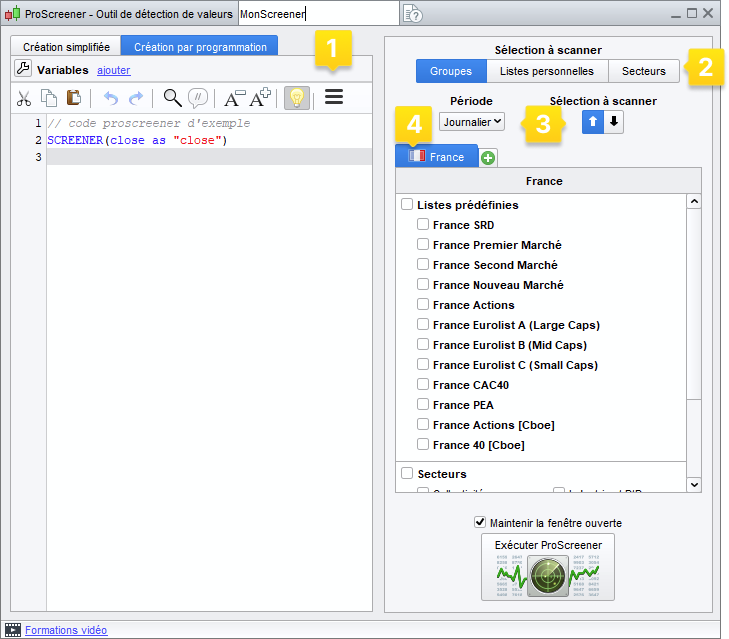
In the first section you can :
- Program a ProScreener directly in the text box
- Use the “Insert Function” help function, which opens a new window with a library of available functions, divided into nine categories, to provide context-sensitive assistance during programming.
As an example, let’s take the “SCREENER” instruction, used to search for conditions (available in the “ProScreener commands” section).
Select the word “SCREENER” and click “Add”: the command will be added to the programming area.
 The “SCREENER” command lets you define which condition(s) to search for.
Let’s suppose we want to find all SRD France stocks whose current bar (period) opening is higher than the previous bar closing. We write :
c1 = (Open >  Close[1])
SCREENER[c1]
Once the code has been defined, in the second section we’ll choose the type of selection on which the screener will be applied: a group, a customized list or a sector.
The third section allows you to define the period used in the ProScreener search. As each course can be viewed according to a different period, a figure found in one view may not exist in another. You can also define the sorting of results. If conditions are not too restrictive, a ProScreener can produce a large number of results (several thousand for the NASDAQ, for example). In such cases, it’s best to filter the results according to one or more criteria of your choice, and display :
- the 50 (or 100[1] ) highest values (of the sorting criterion)
- the 50 (or 1002) lowest values (of the sorting criterion)
The fourth section concerns the choice of group(s), list(s) or sector(s) used for the search.
For example: let’s say your program searches for volumes above 20,000 on daily SRD stocks. The number of search results should logically exceed 50. Setting the sorting criterion to % stock variation, for example, will enable you to display among the results the 50 stocks with the highest or lowest variations.
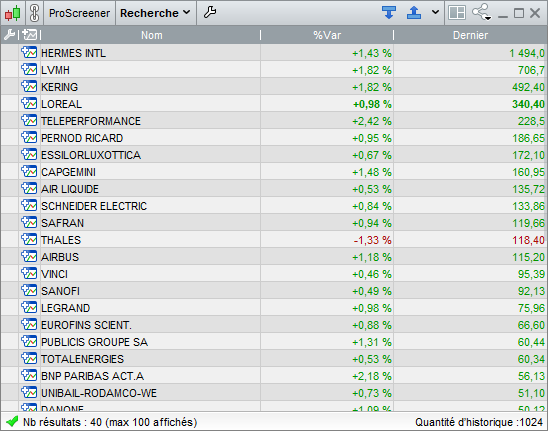
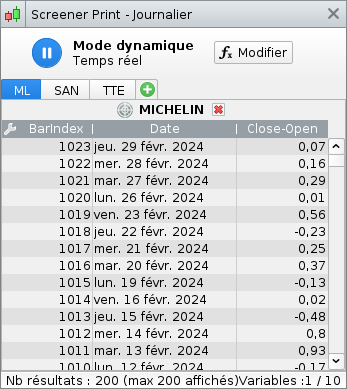
Once these 4 parameters have been defined, click on “Run ProScreener” to launch the search. If any values match your conditions, the results are displayed in a list as shown below
[1] Depending on your version of ProRealTime
Using the Palmarès window
In addition to the ProScreener, ProRealTime offers you the Palmares window. Palmares are real-time scan windows with predefined criteria (unlike ProScreener, which is fully customizable). They enable you to carry out simultaneous searches (e.g.: upward variation in one window, downward variations in the other).
The search criteria proposed in the Palmarès fall into 4 categories and allow you to detect :- Variations and gaps
- The widest pre-opening variations
- The main candlestick figures
- Spread and order book volume values
To learn more about how to use the Palmarès, we recommend watching the video “How to use the Palmarès“.
Chapter II: Programming on ProScreener
This chapter illustrates the 5 ProBuilder commands specific to the ProScreener. You can also find these commands in the Function Library, in the “ProScreener commands” section. We will review :
- Search and filter instructions
- Anticipating volume
- Multi-period search
- Multi-value search
Search and filter instructions
The “SCREENER” command launches the search. It is the equivalent of “RETURN” in ProBuilder and, like the latter, can be followed by a whole range of functions, which we’ll look at together.
“SCREENER” is used as follows:SCREENER[Condition]
Let’s take an example:
c1 = (Close <  BollingerDown[10](Close))
SCREENER[c1]
Let’s find all the stocks in a market whose closing price is strictly below the lower Bollinger Band. The Bollinger Bands are calculated over 10 periods and applied to the closing price.
It is possible to extend the search to several conditions, which can be satisfied at the same time or alternatively. To do this, ProScreener’s syntax is :
SCREENER[Condition1 AND Condition2]
or
SCREENER[Condition1 OR Condition2]
Example:
Let’s look for stocks whose price is above the Bollinger Channel and which show an upward trend.// Fence above the Boll sup Condition1 = (Close > BollingerUp[20](Close)) // Closing > to Opening Condition2 = Close > Open // MM7 > MM23 Condition3 = (Average[7](Close) > Average[23](Close)) SCREENER[Condition1 AND Condition2 AND Condition3]It is also possible to define a constant or indicator (predefined or customized) to be used both as a filter criterion and for sorting results. In fact :
If more than 50 or 100 results match the search, the indicator filters the values to be displayed. In this case, the third section of the programming window allows you to define the order of appearance (see description on page 5).
If fewer than 50 or 100 results match the search, the indicator sorts the results on the basis of this new indicator.
The syntax for using a constant is :SCREENER[c1](Criteria)
For a predefined indicator, it’s best to first store the indicator in a variable (in this case, we’ll call it “Criteria”):
Criteria = RSI[14](Close)
SCREENER[c1](Criteria)If you’re calling up a custom indicator, you’ll need to use the “CALL” instruction defined in the ProBuilder manual.
MyRSI = CALL “RSI“[14]
SCREENER[c1](MyRSI)Example:
Let’s find all the stocks in a market whose volume is greater than 50,000. Let’s create an indicator that allows us to assess whether the RSI is overbought or oversold. We’ll display the ProScreener results sorted according to this indicator.c1 = Volume > 50000 IF RSI[20](Close) > 70 THEN Criteria = 1 ELSIF RSI[20](Close) < 30 THEN Criteria = -1 ENDIF SCREENER[c1](Criteria AS “over-transaction”)Brackets can be omitted by entering the “SORT BY” command:
SCREENER[c1] SORT BY Criteria
If we wish to assign a custom name to this column, we must use the “AS” function, as illustrated below:
SCREENER[c1] SORT BY Criteria AS “typical price”
We can also use the shortened version of the same command:
SCREENER[c1](Criteria AS “typical price”)
Use multiple sorting criteria
The screener also lets you define multiple sorting criteria (3 or 6 depending on the version of ProRealTime used) in the code to display complementary values in the results window, and to be able to change the sorting criteria of a code at runtime without having to modify the code.
Sorting criteria within a screener instruction will be separated by commas.
Example:SCREENER[c1](Criteria AS “sur-transaction”,Criteria2 AS “achat/vente”,number AS “Format Number” DATEFORMAT)This feature will only be available for codes containing a single SCREENER instruction.
Formatting output data
The screener also allows you to specify the type of data to be displayed using format instructions:
- PERCENTFORMAT: Displays column values as a percentage
- STRINGFORMAT: Displays column values without formatting
- NUMBERFORMAT: Displays column values in numeric format
- DATEFORMAT: Displays column values in date format
Let’s take the following number:
number = 20221202Here are the results displayed for the different format types:
Format
Results
SCREENER(number AS “Format Number” PERCENTFORMAT) 2 022 120 200,00%
SCREENER(number AS “Format Number” STRINGFORMAT) 20221202
SCREENER(number AS “Format Number” NUMBERFORMAT) 20,2M
SCREENER(number AS “Format Number” DATEFORMAT) Dec. 2, 2022
Anticipating volume
The “EstimatedVolume” command provides a linear estimate of the volume of the current bar. More precisely, the estimated volume is calculated using the following formula:
Estimated_Volume = Volume * Multiplier_Coefficient
where
Coefficient_Multiplier = duration of the view / time elapsed since the candlestick beganThis command is therefore particularly useful for comparing estimated volume with actual volume.
Let’s look at an example:
In 10-minute view, if we assume that the last candlestick has been drawn for 1 minute, the estimated volume will be equal to 10 times the current volume.
Let’s calculate the ratio of the day’s anticipated volume to the previous day’s volume (for representative results, use an intraday period):// Evaluates the day’s volume Vol0 = EstimatedVolume // Recovers previous day’s volume Vol1 = Volume[1] // Sorting criteria: ratio of the day’s anticipated volume to the previous day’s volume SCREENER SORT BY Vol0 / Vol1 AS “VolumeMulti-period search
You can define a search that checks criteria in several time units. This allows you to check that a condition is met in the short and medium term, for example. The appropriate command is “TIMEFRAME“, and its syntax is as follows:
TIMEFRAME(CODE of period time unit)
The different time units available are expressed in code as :
SIGNIFICANCE CODE 1 minute 1 minute 2 minutes 2 minutes 3 minutes 3 minutes 5 minutes 5 minutes 10 minutes 10 minutes 15 minutes 15 minutes 30 minutes 30 minutes 1 hour 1 hour 2 hours 2 hours 3 hours 3 hours 4 hours 4 hours Daily Daily Weekly Weekly Monthly Monthly Quarterly Quarterly Annual Yearly Instructions following the “TIMEFRAME” line will only be calculated in the period indicated. It is therefore possible to place several “TIMEFRAME” lines in the same code, in order to perform a multi-period search.
Let’s take an example:
We want to find all the Euronext Paris stocks that meet the following criteria:- In the weekly view, the 14-period Williams %R indicator has a value between 0 and -20.
- In the 30-minute view, the 20-period exponential moving average has just crossed the 12-period upwards.
We could therefore detect stocks in overbought zones on a weekly basis, but with a short-term downtrend.
TIMEFRAME(weekly) Condition1 = Williams[14](Close) < 0 AND Williams[14](Close) > -20 TIMEFRAME(30 minutes) Condition2 = ExponentialAverage[20](Close) CROSSES OVER ExponentialAverage[12](Close) SCREENER[Condition1 AND Condition2]To return to the data for the period selected in the ProScreener interface, we can write :
TIMEFRAME(default)
Multi-value search
We have seen that with ProScreener it is necessary to specify a market (or a list) on which to carry out the search.
The “EQUITYFRAME” instruction links the criterion to a specific value.
It is used as follows:
EQUITYFRAME(“market name”, “ticker”)
The command can therefore be used to compare results with a particular value, as well as to construct a new indicator to be used as a sorting condition.
For example, if you wish to display 50 stocks from the Euronext Paris market, with the closing price of the current bar higher than that of the AXA stock (ticker “CS”) as the criterion, you would write :
MyClose = Close EQUITYFRAME(“Euronext Paris”, “CS”) AXAClose = Close SCREENER MyClose>AXAClose SORT BY MyClose as “Close”You can find market names and tickers in the “Instrument search” window. When you run your screener, if a name error occurs in your EQUITYFRAME order, the platform will automatically open the instrument search to allow you to select it.
As with the TIMEFRAME command, any code following EQUITYFRAME will be applied to the value specified by the latter. To return to the market data selected in the ProScreener interface, we can write :
EQUITYFRAME(default)
The two uses described above are complementary, as the following example illustrates:
If you wish to display 50 or 100 randomly selected stocks from the Euronext Paris market, the indicator is calculated by dividing the closing price of the current AXA stock bar (ticker “CS“) by the respective closing price of the selected stocks.
// we begin by retrieving the information to be extracted from the AXA value on Euronext Paris EQUITYFRAME(“Actions France”, “CS”) MyClose = Close // return to the market values selected in the “List selection” drop-down menu EQUITYFRAME(default) // retrieve the information you need CloseVal = MyClose – Close // start display SCREENER SORT BY CloseVal AS “MyIndicator”Example: This screener provides a visual representation of the correlation between a stock and its market. The ratio of the two selected stocks is calculated. We then calculate the difference between this ratio and that of the previous day.
TIMEFRAME(daily) CloseVal = Close // we retrieve Amazon’s closing share price for comparison with the rest of the market EQUITYFRAME(“NASDAQ Equities”, “AMZN”) CloseInd = Close EQUITYFRAME(default) Ratio = (CloseVal / CloseInd) * 100 ForceRelative = (Ratio – Ratio[1]) * 100 SCREENER SORT BY ForceRelative AS “Force Relative”Chapter III: Language specificity in ProScreener
This section describes the specific behavior of certain ProBuilder instructions in the ProScreener module. Each indication below should be considered in addition to the information available in the general ProBuilder documentation.
Print
In ProScreener, when you use the Print instruction, you must define the scanned instruments
on which you want to display data (for debugging purposes, for example).These instruments must be included in the list of scanned values.
Example: With a screener launched on a “France Actions” list, it is not possible to display calculations on the APPLE value (AAPL code).
Values are selected after the screener has been launched:
Up to 10 different instruments can be displayed during screener code executionChapter IV: Practical applications
Simple examples
RSI 1 hour: oversold
The RSI is an overbought/oversold indicator that can be a precursor of a trend reversal. Here, we’re going to detect oversold stocks.
Oversold is defined as : RSI < 30. The closer to zero the RSI, the more pronounced the oversold condition. So we’re going to build a ProScreener that returns all values whose RSI is less than 30.// Calculates the 14-bar RSI MyRSI = RSI[14] // Filter: RSI < 30 Filter = MyRSI < 30 SCREENER[Filter] SORT BY MyRSI AS “RSI”1-hour RSI: overbought
Let’s look for overbought stocks (defined as RSI > 70). The closer to 100 the RSI, the more pronounced the overbought stock, so we’re going to build a screener that returns all stocks with an RSI greater than 70.
// Calculates the 14-bar RSI MyRSI = RSI[14] // Filter: RSI > 70 Filter = MyRSI > 70 SCREENER[Filter] SORT BY MyRSI AS “RSI”Bullish moving average crossover
The aim is to highlight a trend where a short moving average crosses a long moving average.
We’re going to build a ProScreener that returns all stocks whose 20-day moving average crosses the 50-day moving average on the upside.
We also calculate the momentum of the difference between the two moving averages to assess the strength of the crossover. If this number is close to zero, the crossover is slow and the two averages are almost parallel, giving an insignificant signal. On the contrary, the higher the number, the more “dynamic” the crossover. A typical example is that of a flat moving average crossing a moving average with a very clear upward trend.// Calculation of the 20-day moving average Sma20 = Average[20] REM 50-day moving average calculation Sma50 = Average[50] // Evaluates the relative speed of the short moving average compared to the long one Speed = Momentum(Sma50 – Sma20) * 100 / Close // Selects the value at the time of crossover Filter = Sma20 CROSSES OVER Sma50 SCREENER[Filter] SORT BY Speed AS “DynamicBearish moving averages cross
We’re going to build a ProScreener that returns all stocks whose 20-day moving average crosses the 50-day moving average on the downside.
Momentum is defined in the same way as in the previous example.// Calculation of the 20-day moving average Sma20 = Average[20] // 50-day moving average calculation Sma50 = Average[50] // Evaluates the relative speed of the short moving average compared to the long one Speed = Momentum(Sma20 – Sma50) * 100 / Close // Selects the value at the time of crossover Filter = Sma20 CROSSES UNDER Sma50 SCREENER[Filter] SORT BY Speed AS “DynamicMore elaborate examples
RSI and bullish reversal
Here we present a system for detecting in real time the stocks most likely to turn around and trigger a large-scale movement.
Traditionally, analysts would focus on overheating indicators or reversal patterns in isolation from their context (simply because they didn’t have the technical tools to do any better).
Today, with the ProScreener, there are no technical limitations, so we can build a real detection system based on RSI 14. The starting point is simple: we’re looking for an oversold RSI that’s turning upwards.
We therefore set up a filter containing these two conditions, which can be written in a single line of code:
Filter = RSI[14] < 30 AND Momentum[1](RSI[14]) > 0Now that we have the stocks that might interest us, let’s rank them to highlight the most interesting investments. To do this, we’ll consider those whose fall was the most severe, compared with the stock’s usual volatility.
// Filters out stocks whose RSI is oversold or reversing // Filter criteria: RSI < 30 and rising Filter = RSI[14] < 30 AND Momentum[1](RSI[14]) > 0 // Determines the “strength” of the downtrend // Find the highest point on the 20 front bars PointHaut = highest[20](High) // Determines the decline from this point Declin = PointHaut – Close // Determines the stock’s usual volatility (median of the True Range over 3 bars) Norm = summation[3](TR) – highest[3](TR) – lowest[3](TR) Speed = Decline / Norm // Display results SCREENER[Filter] SORT BY Speed AS “Power down”RSI and bearish reversal
The starting point of this ProScreener is the search for an overbought RSI that turns downwards.
As before, let’s set up a filter. This is written in ProBuilder code:Filter = RSI[14] > 70 AND Momentum[1](RSI[14]) < 0In a similar way to the previous ProScreener, we recover the stocks that have risen the most, compared with the stock’s usual volatility.
// Filters out stocks whose RSI is overbought or reversing // Filter criteria: RSI > 70 and decreasing Filter = RSI[14] > 70 AND Momentum[1](RSI[14]) < 0 // Determines the “strength” of the uptrend // Find the lowest point on the previous 20 bars LowPoint = lowest[20](Low) // Determines the price progression from this point Rise = Close – LowPoint // Determines the stock’s usual volatility (median of the True Range over 3 bars) Norm = summation[3](TR) – highest[3](TR) – lowest[3](TR) Speed = Increase / Standard // Screening charts: the most significant relative increases SCREENER[Filter] SORT BY Vitesse AS “Puissance haussiere” (bullish power)Bullish advance
The bullish swallow is one of the best-known Japanese candlestick patterns, but it obviously needs to be considered in context (existence of a trend to be reversed).
Let’s start by defining what a bullish swallow is:
- Previous black candlestick
- Candelabra opening below the body of the previous candelabra
- Current candlestick closing above the body of the previous candlestick
These three conditions can be written simply:
Filter = Close[1] < Open[1] AND Open < Close[1] AND Close > Open[1]To detect a downtrend, we use the previous code, but with a slightly tighter time horizon. Indeed, with RSI 14, it was reasonable to focus on the fall in prices over the previous 20 bars. As far as Japanese candlesticks are concerned, we can consider 8 bars to be sufficient (these are more reactive structures and theoretically limited to 7 candlesticks).
// Determines the “strength” of the downtrend // Find the highest point on the 8 front bars PointHaut = highest[8](High) // Determines the decline from this point Declin = PointHaut – Close // Determines the stock’s usual volatility (median of the True Range over 3 bars) Norm = summation[3](TR) – highest[3](TR) – lowest[3](TR) // Filter criterion: bullish advance Filter = Close[1] < Open[1] AND Open < Close[1] AND Close > Open[1] Speed = Decline / Standard // Screening charts: the most severe relative declines SCREENER[Filter] SORT BY Vitesse AS “Decay power”Bearish trend
Let’s start by defining a bearish swallow:
- Previous white candlestick
- Candelabra opening above the body of the previous candelabra
- Current candlestick closes below the body of the previous candlestick
These three conditions can be written simply:
Filter = Close[1] > Open[1] AND Open > Close[1] AND Close < Open[1]To detect an uptrend, we use the RSI code for a bearish reversal.
// determines the “strength” of the uptrend // Find the lowest point on the 8 front bars LowPoint = lowest[8](Low) // Determines the price progression from this point Rise = Close – LowPoint // Determines the stock’s usual volatility (median of the True Range over 3 bars) Norm = summation[3](TR) – highest[3](TR) – lowest[3](TR) // Filtering criteria: bearish trend Filter = Close[1] > Open[1] AND Open > Close[1] AND Close < Open[1] Speed = Increase / Standard // Screening charts: the most significant relative increases SCREENER[Filter] SORT BY Speed AS “Bullish power”Triple bullish screen
This ProScreener is composed of three conditions over several time units:
- Condition 1: MACD in weekly view < 0
- Condition 2: MACD in weekly ascending view
- Condition 3: Stochastic in daily view < 30
We look for values closer to the STOP level recommended by the system (in this case, the previous day’s highest price).
The ProScreener displays values that are still below this level, and those that have just passed it and remain close by (no more than +5%).
The results displayed respect the conditions in the specified time units (weekly and daily view).
// Condition 1: MACD weekly < 0 and increasing TIMEFRAME(weekly) MyMACD = MACD[12,26,9](Close) c1 = MyMACD < 0 AND MyMACD > MyMACD[1] // Condition 2: Stochastic daily < 30 TIMEFRAME(daily) MySTO = Stochastic[14,3](Close) c2 = MySTO < 30 // Stop-buy level MyStop = High[1] // Criterion: Course position relative to STOP Criteria = (Close / MyStop – 1) * 100 // Condition 3: prices below the STOP or less than +5%. c3 = Criteria < 5 SCREENER[c1 AND c2 AND c3] SORT BY CriteriaTriple bear screen
This ProScreener is composed of three conditions over several time units:
- Condition 1: MACD in weekly view > 0
- Condition 2: MACD in declining weekly view
- Condition 3: Stochastic in daily view > 70
We look for values that are closest to the STOP sale level recommended by the system. This level is the previous day’s lowest price.
The ProScreener displays values which are still above this level, and those which have just passed it and remain close (no more than -5%), in the two specified time units.
// Condition 1: MACD weekly > 0 and decreasing TIMEFRAME(weekly) MyMACD = MACD[12,26,9](Close) c1 = MyMACD > 0 AND MyMACD < MyMACD[1] // Condition 2: Stochastic daily > 70 TIMEFRAME(daily) MySTO = Stochastic[14,3](Close) c2 = MySTO > 70 // Stop sale level MyStop = Low[1] // Criterion: Course position relative to STOP Criteria = (Close / MyStop – 1) * 100 // Condition 3: prices above STOP or less than +5%. c3 = Criteria > -5 SCREENER[c1 AND c2 AND c3] SORT BY CriteriaYou can consult our ProRealTime community on the ProRealCode forum, where you’ll find online documentation and numerous examples.on
ProScreener integrates the ProBuilder programming language (please read the manual beforehand) with extensions that apply exclusively to filter conditions. Real-time or bar-closing searches can be applied to the following time units:
- 1 minute
- 2 minutes
- 3 minutes
- 5 minutes
- 10 minutes
- 15 minutes
- 30 minutes
- 1 hour
- 2 hours
- 3 hours
- 4 hours
- Daily
- Weekly
- Monthly
- Quarterly
- Annual
ProScreener uses the last 256 candlesticks (1024 for premium platforms) of the chosen time unit to calculate your code.
The results of a ProScreener search are displayed as a list of the 50 or 100[*] best values (chosen from the results) based on the defined sort criterion.
This document is an extension of the ProBuilder manual, but can be read independently. Through a guided theoretical approach and concrete examples, you will learn the basics of indicator programming, enabling you to use ProScreener-specific commands to define filters for the various markets available on the platform. At the end of this module, you’ll find a Glossary that will give you an overview of all the commands that can be used in this module.
If you have any further questions about how the ProScreener works, you can ask our ProRealTime community on the ProRealCode forum, where you’ll also find online documentation with numerous examples.
We wish you every success! Enjoy your reading!
[*] Depending on the ProRealTime version used
Chapter I: Fundamental concepts
Go to ProScreener
You can access the ProScreener module by clicking on “View” then “ProScreener”, as shown below:

This brings up the ProScreener window, where you can select an existing code or create a new one.
To do this, click on the key to open the “ProScreeners Management”, then click on “Create” or “Modify” to access the programming window, which offers the choice between :
- Assisted programming”, which lets you define search criterion conditions without programming (to learn more about this feature, we recommend watching the video, “Creating a ProScreener without writing a line of code“).
- Programmed creation”, which lets you create more complex codes and define application parameters.
The Programmed Creation window is divided into 4 sections:
- Programming area
- Selection type
- Time period and sorting direction
- List/group selection

In the first section you can :
- Program a ProScreener directly in the text box
- Use the “Insert Function” help function, which opens a new window with a library of available functions, divided into nine categories, to provide context-sensitive assistance during programming.
As an example, let’s take the “SCREENER” instruction, used to search for conditions (available in the “ProScreener commands” section).
Select the word “SCREENER” and click “Add”: the command will be added to the programming area.

![]() The “SCREENER” command lets you define which condition(s) to search for.
The “SCREENER” command lets you define which condition(s) to search for.
Let’s suppose we want to find all SRD France stocks whose current bar (period) opening is higher than the previous bar closing. We write :
c1 = (Open > Close[1])
SCREENER[c1]Once the code has been defined, in the second section we’ll choose the type of selection on which the screener will be applied: a group, a customized list or a sector.
The third section allows you to define the period used in the ProScreener search. As each course can be viewed according to a different period, a figure found in one view may not exist in another. You can also define the sorting of results. If conditions are not too restrictive, a ProScreener can produce a large number of results (several thousand for the NASDAQ, for example). In such cases, it’s best to filter the results according to one or more criteria of your choice, and display :
- the 50 (or 100[1] ) highest values (of the sorting criterion)
- the 50 (or 1002) lowest values (of the sorting criterion)
The fourth section concerns the choice of group(s), list(s) or sector(s) used for the search.
For example: let’s say your program searches for volumes above 20,000 on daily SRD stocks. The number of search results should logically exceed 50. Setting the sorting criterion to % stock variation, for example, will enable you to display among the results the 50 stocks with the highest or lowest variations.
Once these 4 parameters have been defined, click on “Run ProScreener” to launch the search. If any values match your conditions, the results are displayed in a list as shown below
[1] Depending on your version of ProRealTime

Using the Palmarès window
In addition to the ProScreener, ProRealTime offers you the Palmares window. Palmares are real-time scan windows with predefined criteria (unlike ProScreener, which is fully customizable). They enable you to carry out simultaneous searches (e.g.: upward variation in one window, downward variations in the other).
The search criteria proposed in the Palmarès fall into 4 categories and allow you to detect :
- Variations and gaps
- The widest pre-opening variations
- The main candlestick figures
- Spread and order book volume values

To learn more about how to use the Palmarès, we recommend watching the video “How to use the Palmarès“.
Chapter II: Programming on ProScreener
This chapter illustrates the 5 ProBuilder commands specific to the ProScreener. You can also find these commands in the Function Library, in the “ProScreener commands” section. We will review :
- Search and filter instructions
- Anticipating volume
- Multi-period search
- Multi-value search
Search and filter instructions
The “SCREENER” command launches the search. It is the equivalent of “RETURN” in ProBuilder and, like the latter, can be followed by a whole range of functions, which we’ll look at together.
“SCREENER” is used as follows:
SCREENER[Condition]
Let’s take an example:
c1 = (Close < BollingerDown[10](Close))
SCREENER[c1]Let’s find all the stocks in a market whose closing price is strictly below the lower Bollinger Band. The Bollinger Bands are calculated over 10 periods and applied to the closing price.
It is possible to extend the search to several conditions, which can be satisfied at the same time or alternatively. To do this, ProScreener’s syntax is :
SCREENER[Condition1 AND Condition2]
or
SCREENER[Condition1 OR Condition2]
Example:
Let’s look for stocks whose price is above the Bollinger Channel and which show an upward trend.
// Fence above the Boll sup
Condition1 = (Close >  BollingerUp[20](Close))
// Closing > to Opening
Condition2 = Close >  Open
// MM7 > MM23
Condition3 = (Average[7](Close) > Average[23](Close))
SCREENER[Condition1 AND Condition2 AND Condition3]
It is also possible to define a constant or indicator (predefined or customized) to be used both as a filter criterion and for sorting results. In fact :
If more than 50 or 100 results match the search, the indicator filters the values to be displayed. In this case, the third section of the programming window allows you to define the order of appearance (see description on page 5).
If fewer than 50 or 100 results match the search, the indicator sorts the results on the basis of this new indicator.
The syntax for using a constant is :
SCREENER[c1](Criteria)
For a predefined indicator, it’s best to first store the indicator in a variable (in this case, we’ll call it “Criteria”):
Criteria = RSI[14](Close)
SCREENER[c1](Criteria)
If you’re calling up a custom indicator, you’ll need to use the “CALL” instruction defined in the ProBuilder manual.
MyRSI = CALL “RSI“[14]
SCREENER[c1](MyRSI)
Example:
Let’s find all the stocks in a market whose volume is greater than 50,000. Let’s create an indicator that allows us to assess whether the RSI is overbought or oversold. We’ll display the ProScreener results sorted according to this indicator.
c1 = Volume >  50000
IF RSI[20](Close) > 70 THEN
Criteria = 1
ELSIF RSI[20](Close) < 30 THEN
Criteria = -1
ENDIF
SCREENER[c1](Criteria AS “over-transaction”)
Brackets can be omitted by entering the “SORT BY” command:
SCREENER[c1] SORT BY Criteria
If we wish to assign a custom name to this column, we must use the “AS” function, as illustrated below:
SCREENER[c1] SORT BY Criteria AS “typical price”
We can also use the shortened version of the same command:
SCREENER[c1](Criteria AS “typical price”)
Use multiple sorting criteria
The screener also lets you define multiple sorting criteria (3 or 6 depending on the version of ProRealTime used) in the code to display complementary values in the results window, and to be able to change the sorting criteria of a code at runtime without having to modify the code.
Sorting criteria within a screener instruction will be separated by commas.
Example:
SCREENER[c1](Criteria AS “sur-transaction”,Criteria2 AS “achat/vente”,number AS “Format Number” DATEFORMAT)This feature will only be available for codes containing a single SCREENER instruction.
Formatting output data
The screener also allows you to specify the type of data to be displayed using format instructions:
- PERCENTFORMAT: Displays column values as a percentage
- STRINGFORMAT: Displays column values without formatting
- NUMBERFORMAT: Displays column values in numeric format
- DATEFORMAT: Displays column values in date format
Let’s take the following number:
number = 20221202
Here are the results displayed for the different format types:
|
Format |
Results |
| SCREENER(number AS “Format Number” PERCENTFORMAT) |
2 022 120 200,00% |
| SCREENER(number AS “Format Number” STRINGFORMAT) |
20221202 |
| SCREENER(number AS “Format Number” NUMBERFORMAT) |
20,2M |
| SCREENER(number AS “Format Number” DATEFORMAT) |
Dec. 2, 2022 |
Anticipating volume
The “EstimatedVolume” command provides a linear estimate of the volume of the current bar. More precisely, the estimated volume is calculated using the following formula:
Estimated_Volume = Volume * Multiplier_Coefficient
where
Coefficient_Multiplier = duration of the view / time elapsed since the candlestick began
This command is therefore particularly useful for comparing estimated volume with actual volume.
Let’s look at an example:
In 10-minute view, if we assume that the last candlestick has been drawn for 1 minute, the estimated volume will be equal to 10 times the current volume.
Let’s calculate the ratio of the day’s anticipated volume to the previous day’s volume (for representative results, use an intraday period):
// Evaluates the day’s volume
Vol0 = EstimatedVolume
// Recovers previous day’s volume
Vol1 = Volume[1]
// Sorting criteria: ratio of the day’s anticipated volume to the previous day’s volume
SCREENER SORT BY Vol0 / Vol1 AS “Volume
Multi-period search
You can define a search that checks criteria in several time units. This allows you to check that a condition is met in the short and medium term, for example. The appropriate command is “TIMEFRAME“, and its syntax is as follows:
TIMEFRAME(CODE of period time unit)
The different time units available are expressed in code as :
| SIGNIFICANCE | CODE |
| 1 minute | 1 minute |
| 2 minutes | 2 minutes |
| 3 minutes | 3 minutes |
| 5 minutes | 5 minutes |
| 10 minutes | 10 minutes |
| 15 minutes | 15 minutes |
| 30 minutes | 30 minutes |
| 1 hour | 1 hour |
| 2 hours | 2 hours |
| 3 hours | 3 hours |
| 4 hours | 4 hours |
| Daily | Daily |
| Weekly | Weekly |
| Monthly | Monthly |
| Quarterly | Quarterly |
| Annual | Yearly |
Instructions following the “TIMEFRAME” line will only be calculated in the period indicated. It is therefore possible to place several “TIMEFRAME” lines in the same code, in order to perform a multi-period search.
Let’s take an example:
We want to find all the Euronext Paris stocks that meet the following criteria:
- In the weekly view, the 14-period Williams %R indicator has a value between 0 and -20.
- In the 30-minute view, the 20-period exponential moving average has just crossed the 12-period upwards.
We could therefore detect stocks in overbought zones on a weekly basis, but with a short-term downtrend.
TIMEFRAME(weekly)
Condition1 = Williams[14](Close) < 0 AND Williams[14](Close) > -20
TIMEFRAME(30 minutes)
Condition2 = ExponentialAverage[20](Close) CROSSES OVER ExponentialAverage[12](Close)
SCREENER[Condition1 AND Condition2]
To return to the data for the period selected in the ProScreener interface, we can write :
TIMEFRAME(default)
Multi-value search
We have seen that with ProScreener it is necessary to specify a market (or a list) on which to carry out the search.
The “EQUITYFRAME” instruction links the criterion to a specific value.
It is used as follows:
EQUITYFRAME(“market name”, “ticker”)
The command can therefore be used to compare results with a particular value, as well as to construct a new indicator to be used as a sorting condition.
For example, if you wish to display 50 stocks from the Euronext Paris market, with the closing price of the current bar higher than that of the AXA stock (ticker “CS”) as the criterion, you would write :
MyClose = Close
EQUITYFRAME(“Euronext Paris”, “CS”)
AXAClose = Close
SCREENER MyClose>AXAClose SORT BY MyClose as “Close”
You can find market names and tickers in the “Instrument search” window. When you run your screener, if a name error occurs in your EQUITYFRAME order, the platform will automatically open the instrument search to allow you to select it.
As with the TIMEFRAME command, any code following EQUITYFRAME will be applied to the value specified by the latter. To return to the market data selected in the ProScreener interface, we can write :
EQUITYFRAME(default)
The two uses described above are complementary, as the following example illustrates:
If you wish to display 50 or 100 randomly selected stocks from the Euronext Paris market, the indicator is calculated by dividing the closing price of the current AXA stock bar (ticker “CS“) by the respective closing price of the selected stocks.
// we begin by retrieving the information to be extracted from the AXA value on Euronext Paris
EQUITYFRAME(“Actions France”, “CS”)
MyClose = Close
// return to the market values selected in the “List selection” drop-down menu
EQUITYFRAME(default)
// retrieve the information you need
CloseVal = MyClose – Close
// start display
SCREENER SORT BY CloseVal AS “MyIndicator”
Example: This screener provides a visual representation of the correlation between a stock and its market. The ratio of the two selected stocks is calculated. We then calculate the difference between this ratio and that of the previous day.
TIMEFRAME(daily)
CloseVal = Close
// we retrieve Amazon’s closing share price for comparison with the rest of the market
EQUITYFRAME(“NASDAQ Equities”, “AMZN”)
CloseInd = Close
EQUITYFRAME(default)
Ratio = (CloseVal / CloseInd) * 100
ForceRelative = (Ratio – Ratio[1]) * 100
SCREENER SORT BY ForceRelative AS “Force Relative”
Chapter III: Language specificity in ProScreener
This section describes the specific behavior of certain ProBuilder instructions in the ProScreener module. Each indication below should be considered in addition to the information available in the general ProBuilder documentation.
In ProScreener, when you use the Print instruction, you must define the scanned instruments
on which you want to display data (for debugging purposes, for example).
These instruments must be included in the list of scanned values.
Example: With a screener launched on a “France Actions” list, it is not possible to display calculations on the APPLE value (AAPL code).
Values are selected after the screener has been launched:

Up to 10 different instruments can be displayed during screener code execution
Chapter IV: Practical applications
Simple examples
RSI 1 hour: oversold
The RSI is an overbought/oversold indicator that can be a precursor of a trend reversal. Here, we’re going to detect oversold stocks.
Oversold is defined as : RSI < 30. The closer to zero the RSI, the more pronounced the oversold condition. So we’re going to build a ProScreener that returns all values whose RSI is less than 30.
// Calculates the 14-bar RSI
MyRSI = RSI[14]
// Filter: RSI < 30
Filter = MyRSI < 30
SCREENER[Filter] SORT BY MyRSI AS “RSI”
1-hour RSI: overbought
Let’s look for overbought stocks (defined as RSI > 70). The closer to 100 the RSI, the more pronounced the overbought stock, so we’re going to build a screener that returns all stocks with an RSI greater than 70.
// Calculates the 14-bar RSI
MyRSI = RSI[14]
// Filter: RSI > 70
Filter = MyRSI > 70
SCREENER[Filter] SORT BY MyRSI AS “RSI”
Bullish moving average crossover
The aim is to highlight a trend where a short moving average crosses a long moving average.
We’re going to build a ProScreener that returns all stocks whose 20-day moving average crosses the 50-day moving average on the upside.
We also calculate the momentum of the difference between the two moving averages to assess the strength of the crossover. If this number is close to zero, the crossover is slow and the two averages are almost parallel, giving an insignificant signal. On the contrary, the higher the number, the more “dynamic” the crossover. A typical example is that of a flat moving average crossing a moving average with a very clear upward trend.
// Calculation of the 20-day moving average
Sma20 = Average[20]
REM 50-day moving average calculation
Sma50 = Average[50]
// Evaluates the relative speed of the short moving average compared to the long one
Speed = Momentum(Sma50 – Sma20) * 100 / Close
// Selects the value at the time of crossover
Filter = Sma20 CROSSES OVER Sma50
SCREENER[Filter] SORT BY Speed AS “Dynamic
Bearish moving averages cross
We’re going to build a ProScreener that returns all stocks whose 20-day moving average crosses the 50-day moving average on the downside.
Momentum is defined in the same way as in the previous example.
// Calculation of the 20-day moving average
Sma20 = Average[20]
// 50-day moving average calculation
Sma50 = Average[50]
// Evaluates the relative speed of the short moving average compared to the long one
Speed = Momentum(Sma20 – Sma50) * 100 / Close
// Selects the value at the time of crossover
Filter = Sma20 CROSSES UNDER Sma50
SCREENER[Filter] SORT BY Speed AS “Dynamic
More elaborate examples
RSI and bullish reversal
Here we present a system for detecting in real time the stocks most likely to turn around and trigger a large-scale movement.
Traditionally, analysts would focus on overheating indicators or reversal patterns in isolation from their context (simply because they didn’t have the technical tools to do any better).
Today, with the ProScreener, there are no technical limitations, so we can build a real detection system based on RSI 14. The starting point is simple: we’re looking for an oversold RSI that’s turning upwards.
We therefore set up a filter containing these two conditions, which can be written in a single line of code:
Filter = RSI[14] < 30 AND Momentum[1](RSI[14]) > 0Now that we have the stocks that might interest us, let’s rank them to highlight the most interesting investments. To do this, we’ll consider those whose fall was the most severe, compared with the stock’s usual volatility.
// Filters out stocks whose RSI is oversold or reversing
// Filter criteria: RSI < 30 and rising
Filter = RSI[14] < 30 AND Momentum[1](RSI[14]) > 0
// Determines the “strength” of the downtrend
// Find the highest point on the 20 front bars
PointHaut = highest[20](High)
// Determines the decline from this point
Declin = PointHaut – Close
// Determines the stock’s usual volatility (median of the True Range over 3 bars)
Norm = summation[3](TR) – highest[3](TR) – lowest[3](TR)
Speed = Decline / Norm
// Display results
SCREENER[Filter] SORT BY Speed AS “Power down”
RSI and bearish reversal
The starting point of this ProScreener is the search for an overbought RSI that turns downwards.
As before, let’s set up a filter. This is written in ProBuilder code:
Filter = RSI[14] > 70 AND Momentum[1](RSI[14]) < 0In a similar way to the previous ProScreener, we recover the stocks that have risen the most, compared with the stock’s usual volatility.
// Filters out stocks whose RSI is overbought or reversing
// Filter criteria: RSI > 70 and decreasing
Filter = RSI[14] > 70 AND Momentum[1](RSI[14]) < 0
// Determines the “strength” of the uptrend
// Find the lowest point on the previous 20 bars
LowPoint = lowest[20](Low)
// Determines the price progression from this point
Rise = Close – LowPoint
// Determines the stock’s usual volatility (median of the True Range over 3 bars)
Norm = summation[3](TR) – highest[3](TR) – lowest[3](TR)
Speed = Increase / Standard
// Screening charts: the most significant relative increases
SCREENER[Filter] SORT BY Vitesse AS “Puissance haussiere” (bullish power)
Bullish advance
The bullish swallow is one of the best-known Japanese candlestick patterns, but it obviously needs to be considered in context (existence of a trend to be reversed).
Let’s start by defining what a bullish swallow is:
- Previous black candlestick
- Candelabra opening below the body of the previous candelabra
- Current candlestick closing above the body of the previous candlestick
These three conditions can be written simply:
Filter = Close[1] < Open[1] AND Open < Close[1] AND Close > Open[1]To detect a downtrend, we use the previous code, but with a slightly tighter time horizon. Indeed, with RSI 14, it was reasonable to focus on the fall in prices over the previous 20 bars. As far as Japanese candlesticks are concerned, we can consider 8 bars to be sufficient (these are more reactive structures and theoretically limited to 7 candlesticks).
// Determines the “strength” of the downtrend
// Find the highest point on the 8 front bars
PointHaut = highest[8](High)
// Determines the decline from this point
Declin = PointHaut – Close
// Determines the stock’s usual volatility (median of the True Range over 3 bars)
Norm = summation[3](TR) – highest[3](TR) – lowest[3](TR)
// Filter criterion: bullish advance
Filter = Close[1] < Open[1] AND Open <  Close[1] AND Close >  Open[1]
Speed = Decline / Standard
// Screening charts: the most severe relative declines
SCREENER[Filter] SORT BY Vitesse AS “Decay power”
Bearish trend
Let’s start by defining a bearish swallow:
- Previous white candlestick
- Candelabra opening above the body of the previous candelabra
- Current candlestick closes below the body of the previous candlestick
These three conditions can be written simply:
Filter = Close[1] > Open[1] AND Open > Close[1] AND Close < Open[1]To detect an uptrend, we use the RSI code for a bearish reversal.
// determines the “strength” of the uptrend
// Find the lowest point on the 8 front bars
LowPoint = lowest[8](Low)
// Determines the price progression from this point
Rise = Close – LowPoint
// Determines the stock’s usual volatility (median of the True Range over 3 bars)
Norm = summation[3](TR) – highest[3](TR) – lowest[3](TR)
// Filtering criteria: bearish trend
Filter = Close[1] > Open[1] AND Open >  Close[1] AND Close <  Open[1]
Speed = Increase / Standard
// Screening charts: the most significant relative increases
SCREENER[Filter] SORT BY Speed AS “Bullish power”
Triple bullish screen
This ProScreener is composed of three conditions over several time units:
- Condition 1: MACD in weekly view < 0
- Condition 2: MACD in weekly ascending view
- Condition 3: Stochastic in daily view < 30
We look for values closer to the STOP level recommended by the system (in this case, the previous day’s highest price).
The ProScreener displays values that are still below this level, and those that have just passed it and remain close by (no more than +5%).
The results displayed respect the conditions in the specified time units (weekly and daily view).
// Condition 1: MACD weekly < 0 and increasing
TIMEFRAME(weekly)
MyMACD = MACD[12,26,9](Close)
c1 = MyMACD < 0 AND MyMACD > MyMACD[1]
// Condition 2: Stochastic daily < 30
TIMEFRAME(daily)
MySTO = Stochastic[14,3](Close)
c2 = MySTO < 30
// Stop-buy level
MyStop = High[1]
// Criterion: Course position relative to STOP
Criteria = (Close / MyStop – 1) * 100
// Condition 3: prices below the STOP or less than +5%.
c3 = Criteria < 5
SCREENER[c1 AND c2 AND c3] SORT BY Criteria
Triple bear screen
This ProScreener is composed of three conditions over several time units:
- Condition 1: MACD in weekly view > 0
- Condition 2: MACD in declining weekly view
- Condition 3: Stochastic in daily view > 70
We look for values that are closest to the STOP sale level recommended by the system. This level is the previous day’s lowest price.
The ProScreener displays values which are still above this level, and those which have just passed it and remain close (no more than -5%), in the two specified time units.
// Condition 1: MACD weekly > 0 and decreasing
TIMEFRAME(weekly)
MyMACD = MACD[12,26,9](Close)
c1 = MyMACD > 0 AND MyMACD < MyMACD[1]
// Condition 2: Stochastic daily > 70
TIMEFRAME(daily)
MySTO = Stochastic[14,3](Close)
c2 = MySTO > 70
// Stop sale level
MyStop = Low[1]
// Criterion: Course position relative to STOP
Criteria = (Close / MyStop – 1) * 100
// Condition 3: prices above STOP or less than +5%.
c3 = Criteria > -5
SCREENER[c1 AND c2 AND c3] SORT BY Criteria
You can consult our ProRealTime community on the ProRealCode forum, where you’ll find online documentation and numerous examples.
- Introducing ProScreener
- Introducing ProScreener
- Chapter I: Fundamental concepts
- Chapter II: Programming on ProScreener
- Chapter III: Language specificity in ProScreener
- Chapter IV: Practical applications
- Simple examples
- RSI 1 hour: oversold
- 1-hour RSI: overbought
- Bullish moving average crossover
- Bearish moving averages cross
- More elaborate examples
- Chapter I: Fundamental concepts
- Chapter II: Programming on ProScreener
- Chapter III: Language specificity in ProScreener
- Chapter IV: Practical applications