

Yearly pivot points
October 26, 2016, 3:02 PM
Indicators
15 Comments
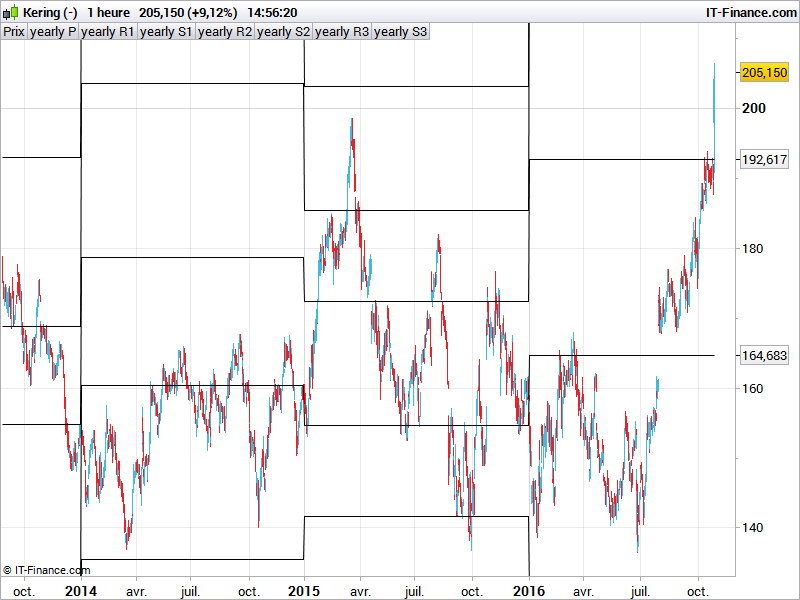
Here is an annual pivot points indicator that complete the whole series of pivot points indis that can be found in our prorealtime code library. Like the other ones, this one embed 3 different kind of calculation that can be changed at will with the variable “mode” available at line 8 of the code.
To compute correctly, the indicator need sufficient amount of data, especially on intraday timeframe.
coded by request on the French forums.
//PRC_YearlyPivotPoints | indicator
//26.10.2016
//Nicolas @ www.prorealcode.com
//Sharing ProRealTime knowledge
//adapted from PRT original indicator

//select mode of calculation of the yearly pivot points (0,1,2)
mode = 0

If Year<>Year[1] then
 yearlyHigh = Highest[BarIndex - lastYearBarIndex](High)[1]
 yearlyLow = Lowest[BarIndex - lastYearBarIndex](Low)[1]
 lastYearBarIndex = BarIndex

 If mode = 0 then
  yearlyPivot = (yearlyHigh + yearlyLow + Close[1]) / 3
 Elsif mode = 1 then
  yearlyPivot = (Open + yearlyHigh + yearlyLow + Close[1]) / 4
 Elsif mode = 2 then
  yearlyPivot = (yearlyHigh + yearlyLow + Close[1]*2) / 4
 Else
  yearlyPivot = (Open*2 + yearlyHigh + yearlyLow) / 4
 Endif
 yearlyR1 = 2*yearlyPivot - yearlyLow
 yearlyS1 = 2*yearlyPivot - yearlyHigh
 yearlyR2 = yearlyPivot + (yearlyHigh - yearlyLow)
 yearlyS2 = yearlyPivot - (yearlyHigh - yearlyLow)
 yearlyR3 = yearlyR1 + (yearlyHigh - yearlyLow)
 yearlyS3 = yearlyS1 - (yearlyHigh - yearlyLow)
Endif

return yearlyPivot as "yearly P", yearlyR1 as "yearly R1", yearlyS1 as "yearly S1", yearlyR2 as "yearly R2", yearlyS2 as "yearly S2", yearlyR3 as "yearly R3", yearlyS3 as "yearly S3"
Download
Filename:
PRC_YearlyPivotPoints.itf
Downloads:
133

Master
Trader, Programmer, Coder enthusiast. Work with each other for a common goal.
Author’s Profile
Comments
Loading...