

Tested Levels Indicator
February 21, 2020, 11:07 AM
Indicators
7 Comments
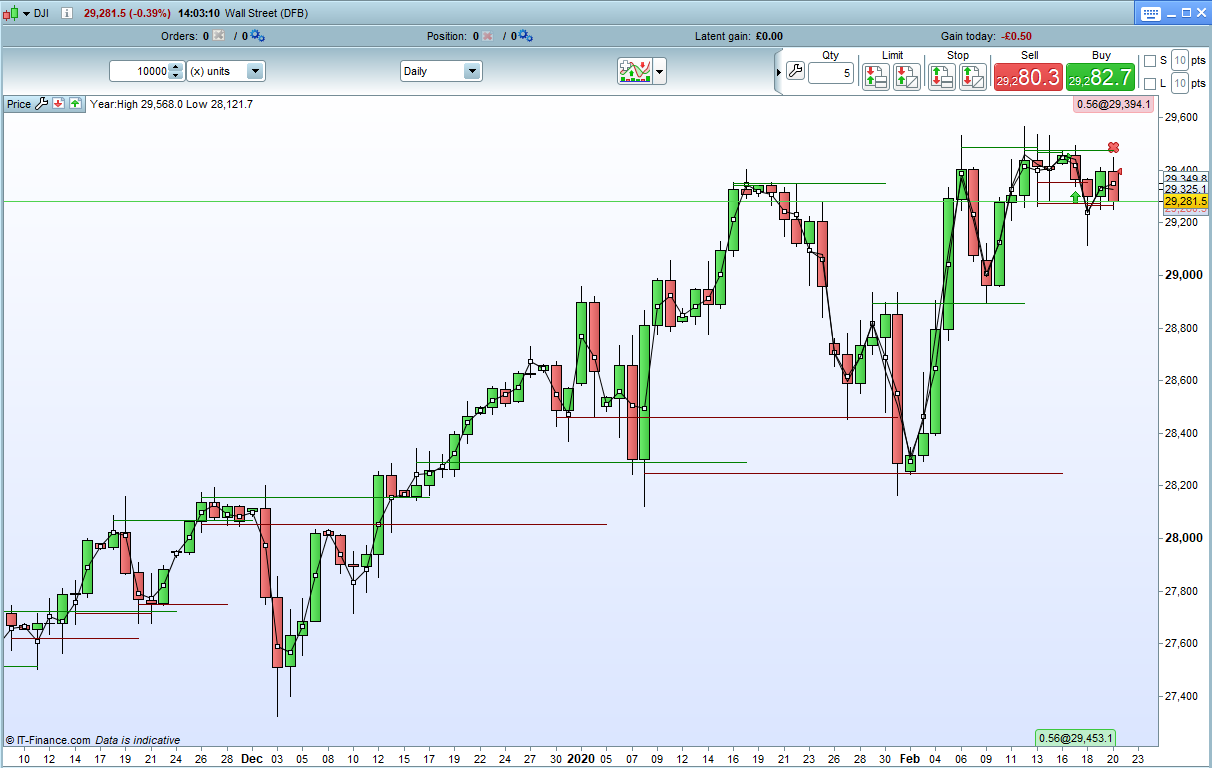
This indicator checks back over the last ‘p’ bars to see if the mid point of the current bars shadows have been tested by price and failed to breakout before.
Set ‘tests’ to the quantity of level tests you want to check for.
The indicator will draw a line from the first price test bar until a new set of price tests are detected. It draws green lines for upper shadow tests and red lines for lower shadow tests.
It can be slow to draw so I recommend setting the CALCULATEONLASTBARS to a sensible level.
I advise downloading and importing the ITF file to get full functionality.
//Tested Levels Indicator
//By Vonasi
//Date:20022020

defparam calculateonlastbars = 1000

//p = 200
//tests = 3

if barindex >=tests then

level = (high + max(open,close))/2

count = 1
draw = 0
for a = 1 to p
if close[a] > level then
break
endif
if high[a] >= level and max(close[a],open[a]) <= level then
count = count + 1
if count = tests then
startindex = barindex-a
draw = 1
break
endif
endif
next

if draw = 1 then
drawsegment(startindex,level,barindex,level) coloured(0,128,0)
lastlevel = level
else
drawsegment(barindex-1,lastlevel,barindex,lastlevel) coloured(0,128,0)
endif

level2 = (low + min(open,close))/2

count = 1
draw2 = 0
for a = 1 to p
if close[a] < level2 then
break
endif
if low[a] <= level2 and min(close[a],open[a]) >= level2 then
count = count + 1
if count = tests then
startindex2 = barindex-a
draw2 = 1
break
endif
endif
next

if draw2 = 1 then
drawsegment(startindex2,level2,barindex,level2) coloured(128,0,0)
lastlevel2 = level2
else
drawsegment(barindex-1,lastlevel2,barindex,lastlevel2) coloured(128,0,0)
endif
endif

return
Download
Filename:
Screenshot_1-3.png
Downloads:
170
Download
Filename:
Tested-Levels.itf
Downloads:
782

Master
V-oyaging ON A S-mall I-ncome
Author’s Profile
Loading...