

MACD CCI Overlay
February 20, 2020, 1:11 PM
Indicators
5 Comments
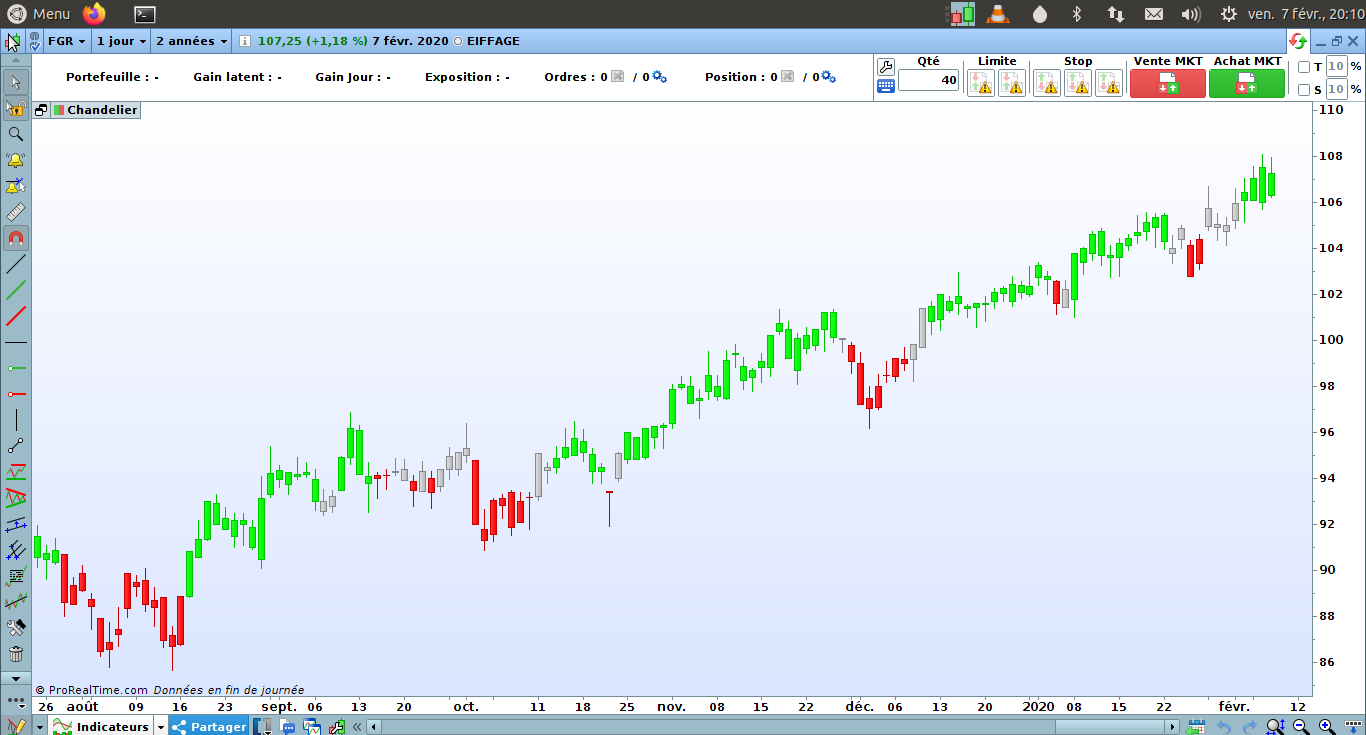
Paint the candlesticks with conditions based on CCI and MACD.
- green color when cci [14] > 0 and macd line > signal line
- red color when cci [14] < 0 and macd line < signal line
- grey color when cci > 0 and macd line< signal line or cci < 0 and macd line> signal line
// Variable

a=CCI[14](typicalPrice)
b=MACDline[12,26,9](close)
c = ExponentialAverage[9](b)


//Hausse
if a > 0 and b > c then
r = 0
b = 0
g = 255

//Baisse
elsif a < 0 and b < c then
r = 255
b = 0
g = 0

//Neutre
elsif a > 0 and b < c OR a < 0 and b > c then
r = 195
g = 195
b = 195
endif

DRAWCANDLE(open,high,low,close) coloured(r,g,b)

RETURN
Download
Filename:
MACD-CCI-overlay.itf
Downloads:
265
Junior
Operating in the shadows, I hack problems one by one. My bio is currently encrypted by a complex algorithm. Decryption underway...
Author’s Profile
Loading...